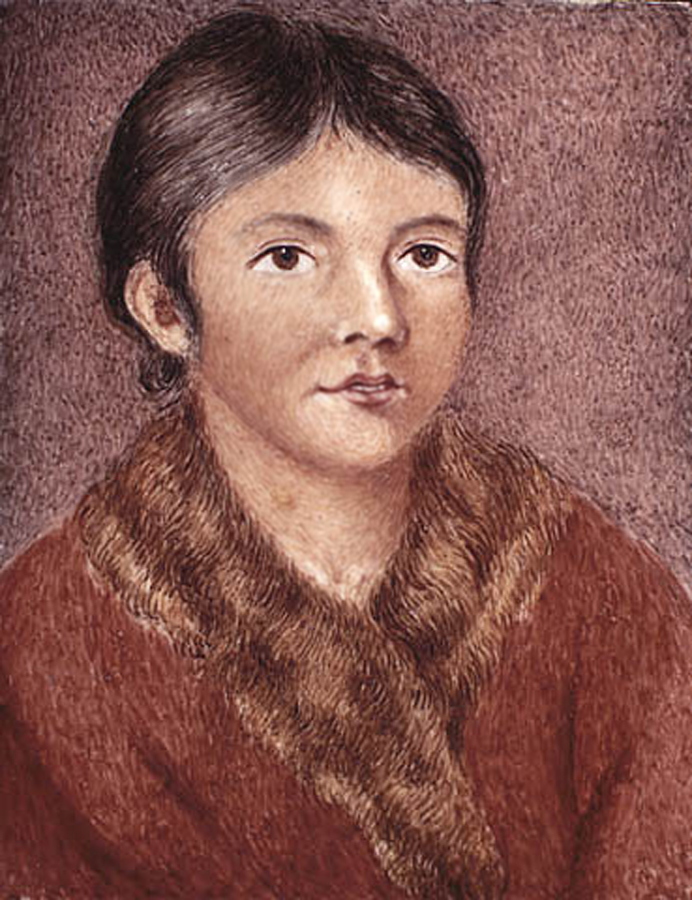
This is not a story of triumph. It is not one of recovery. It is a story that can only be told in pieces—through compromised archives, second-hand accounts, and maps shot through with power relations. Certain basic contours can be confirmed, as they appear in both Indigenous and settler versions of the events: one early morning in March 1819, a small group of Beothuk—the indigenous inhabitants of the island now known as Newfoundland—were at their winter camp on the north side of Red Indian Lake, a long and narrow body of water at the island's center, when they were awakened by the sound of intruders. (The Beothuk were also known as the Red Indians, both to the neighboring Mi'kmaq and to the British, because of the distinctive red ochre that they used to color their bodies and faces). A group of British settlers had surrounded the Beothuk camp. While the settlers' intentions were not yet known, the Beothuk had cause for alarm. Every previous encounter with the British had ended in devastation and death. This encounter would soon result in the same.
Before moving further, it is important to mark the much longer history of uninvited encounter between the Beothuk and a range of European groups. Archeological evidence suggests that the Beothuk intermittently interacted with Norse fishermen as early as the eleventh century, during the fishermen's seasonal trips to the Newfoundland coast. A second phase of more sustained encounter began shortly after the Italian explorer John Cabot's initial visit to the island, in 1497, and persisted for over two hundred years. During this time, "fishing crews from Spain, Portugal, France, and Britain would spend the summer months catching and processing cod before returning home for the winter," as settler scholar Fiona Polack explains. These seasonal incursions granted the Beothuk "periods of unimpeded access to valuable materials, such as metal objects left in unattended fishing stations, and reduced the need for them to interact directly with the invaders." Polack also documents how this arrangement—to which, of course, the Beothuk had no choice but to consent—began to strain as "increasing numbers of people from the British isles began to settle permanently on the island and compete directly with the Beothuk for resources." It was this competition for resources, against the larger backdrop of settler colonialism, that in no small part led the British to Red Indian Lake that day.
But there were other, more direct motivations: several months earlier, on September 18th, 1818, it was the Beothuk who had surprised the same group of settlers as they were preparing for a trip to market. Hidden in a canoe under a wharf at Lower Sandy Point, in the Bay of Exploits—north and east of Red Indian Lake, where its waters met up with the sea—the Beothuk waited for the "dense darkness" of night before absconding with a season's catch of salmon, and possibly some furs, that the settlers had loaded onto the boat before going to sleep. While the boat was recovered the next morning on the other side of the bay, "everything of a portable nature, including the cordage and the sails" was gone. This "theft" provided the rationale for John Peyton Jr., the owner of the boat, to request formal authorization from the governor of colonial Newfoundland to "search for his stolen property and, if possible, try and capture one of the Indians alive." The Beothuk did not know about the kidnapping authorization when they awoke that late winter morning to find intruders in their camp. But within minutes, the settlers' detestable goal became clear. When the Beothuk fled to the woods, one woman, Demasduit, fell behind and was immediately set upon by the British. She "pointed out to the white men her full breasts to show that she had a child, and pointed up to the heavens to implore them, in God's mercy, to allow her to return to her child," but they "took hold of her," recalled John Paul, a Mi'kmaq-Innu man whose grandfather had been alive (but not present) at the time of the original events. Demasduit's partner, a man named Nonosabasut, "came to her aid," but Peyton shot and killed him. Two days later, the child of Demasduit and Nonosabasut died as well—likely the result of starvation. One other woman, Shanawdithit, who was then in her late teens, bore witness to it all. Her hand-drawn maps, which provide us with the stories and statistics that record this colonial violence, constitute this chapter's core. [MAP BROWSER OF THE FIVE HOWLEY MAPS???]
Before moving forward, we must step back one again. Who is it, more precisely, who have created this narrative, and who is it who we presume to be reading these words? What are our obligations to Shanawdithit and the maps she created? And what obligations are yours?
By our use of the term "obligation," we intend to denote the more specific form of responsibility that is characteristic of many Indigenous knowledge practices. This responsibility entails an acknowledgement of the places—both literal and figurative—from which we do our work, as well as an awareness of how those places inform our relationships with those whom our work touches. Here we are indebted to Max Liboiron (Red River Métis/Michif) for their discussion of obligation in the context of anticolonial research, and their insistence that "we isn't specific enough for obligation" (24). It is not.
Our "we"—the members of this research team—does not contain any Indigenous team members, and is important to be explicit about this fact. While we have sought approval from TK for the contents of this narrative, as well as the images that we have chosen to share, we remain aware of the limits of our knowledge, as well as of the long history—passing through Shanawdithit herself—of extracting Indigenous knowledge for colonial gain. For this reason, we do not claim this project as a decolonial one. Rather, bearing our obligations in mind, we have attempted to adopt an anticolonial approach to the materials in this chapter. At each phase of our process, we asked ourselves how we could resist reproducing the "settler and colonial entitlement to Land and Indigenous cultures" that Liboiron identifies, rightly, as a hallmark of academic research (132). This is most directly expressed in our intentional focus on Shanawdithit's maps for how they illuminate the significance of the colonial archive and the history of violence that it records, rather than for what they might tell us about Shanawdithit and her Beothuk kin.
As a team of (mostly) settler scholars, we view it as among our specific responsibilities to sit with the violence recorded in the archive and to absorb its second-order harms. As we consider which details are essential to convey for the purposes of our argument about colonial power, we take seriously two additional areas of concern. First is the additional harm brought about by restaging colonial violence, as has been theorized with respect to the archive of slavery by Saidiya Hartman (settler) and, more recently, in the context of Black/Indigenous relations by Tiffany Lesthabo King (second). Second is the allure, as voiced by Liboiron, following Eve Tuck (Unangax), of advancing "a theory of change that establishes harm or injury in order to achieve reparation" (Liboiron 34). The details that follow, many of which do contain evidence of injury or harm, are presented in the service of underscoring how the map at the center of this chapter cannot be separated from the colonial violence that produced it. Throughout this chapter, we have attempted to prioritiz Indigenous sources and Indigenous scholars, while remaining attuned to moments that might signal when certain experiences, or ways of knowing, might lie beyond what settler scholars can comprehend.
As readers and viewers, you too are a part of this chapter, and for this reason, we ask that you commit to a set of obligations as well:
[ INTERACTIVE CHECK BOXES OF PRINCIPLES ] I will remain aware of the long history of extracting Indigenous knowledge for colonial gain.
I will commit to contemplating any new knowledge I might acquire, rather than immediately shift to considering its future use.
I will remind myself of the limits of my own knowledge.
I will commit to making space for what I cannot or should not understand I will recall the second-order violence as I read the history that follows I will commit to retaining the colonial frame around this history, as I will around the history of data visualization as a whole.
We now return to the story of Shanawdithit and her maps as it emerges through the colonial archive. This story passes directly through Demasduit and her own eventual fate. Evidently, Demasduit made several attempts to escape her captors, but in the end, the British prevailed. She was taken first to the fishing village of Twillingate and then in the spring, after the ice had cleared, to the colony of St. John's. At some point during this time, she contracted tuberculosis. She succumbed to the disease less than a year later, while aboard a boat that was intended to return her to her family. With the death of Demasduit, the British achieved their goal of grossly distorted retribution.
Shanawdithit was present the day that Demasduit's body was returned to Red Indian Lake, and she directly participated in Demasduit's funeral ceremony held the next spring. But the British would not learn of Shanawdithit's presence during this time, or her memory of same, until four years later, in April 1823, when Shanawdithit was herself captured, along with her mother and her sister. The three women had been heading "to the seacoast in search of mussels to subsist on," following another winter in which food had been scarce and illness had been plentiful, when another group of British settlers—furriers, this time—came across them. Concluding that it had become too difficult to continue to keep themselves alive, Shanawdithit and her kin "allowed themselves in despair to be quietly captured," according to another British account.
Like Demsaduit before them, the three women were taken to Twillingate, where they were held captive in the home of none other than John Peyton Jr., the owner of the boat that had set the kidnapping of Demasduit in motion. Shanawdithit's mother and sister soon died, also of tuberculosis. But Shanawdithit persevered. For five years, she was forced to work for Peyton as a domestic servant, before she too fell ill. Tracing the path of Demasduit's final journey, Shanawdithit was then brought to St. John, to the home of William Epps Cormack, where she lived for the final months of her life. Cormack was the one to supply her with "paper and pencils of various colours," and who through some combination of enticement or coercion—we can never know—prompted her to create her maps. A copy of the map known as "Sketch II" is shown below.
This map, second in a sequence of five, presents a syncretic picture of the series of encounters between the Beothuk and the British that culminated in Demasduit's capture and eventual death. While the events that Shanawdithit depicts span decades—a hallmark of Indigenous mapping practice, to be discussed in depth below—on the map they are anchored in place by Red Indian Lake.
The lower half of the map depicts an earlier encounter between the two groups which took place on the south side of the lake in the winter of 1810-11. Twenty or so figures appear along the bank of the river. The figures drawn in red are Beothuk. Those in black are the members of the British party, led by a Scottish naval officer named David Buchan. They are pictured after their initial meeting, which was enabled by Mi'kmaq and Innu guides.
The group of figures set to the right of the larger group—two black figures and four red ones— likely stand for the two marines and four Beothuk whose (justified) suspicion would result in the murder of the two marines the next day. The two red figures oriented in the opposite direction may be the two Beothuk who briefly traveled with the British back to their camp before they were “told by signals to give chase,” as John Paul reports.
Off to the east—the right side of the page—is the Beothuk winter camp. Three triangles stand for the three dwellings, called mamateeks, which housed the group. Thirty-seven marks stand for each of the 37 inhabitants in the winter camp that year.
The dotted lines on the map correspond to paths taken across the frozen lake during those years, connecting the two sides of the lake together as well as the series of events.
On the north side we also see several mamateeks—two drawn in red at the center of the shoreline, and a third drawn in black just off to the east. The black color and rectangular shape indicating that it is covered in the sail from Peyton's boat.
A second set of mamateeks are positioned to the west of the winter camp; these may be the two mamateeks to which the Beothuk fled after the deadly encounter with Buchan's men, but this is not certain.
As for the events themselves, we see several phases of Demasduit's capture superimposed. Viewed chronologically, we first see several settlers to the east, drawn in black, whom we are told by Peyton, via Cormack, and presumably first via Shanawdithit, are some of Peyton's men who have hidden themselves in order to surveil the Beothuk camp before their morning attack.
In the center of the map we see several groups of red figures pictured along various footpaths; these, we might conclude, are the inhabitants of the winter camp who sought safety in the woods upon being attacked.
On the frozen lake is another group of figures. The main cluster is composed of six figures in black and one in red, presumably Demasduit in the initial moment of capture. To the left of that group is a large red figure, likely Nonosabasut depicted in the act of defending his wife. Just south of the group is another red figure on the ground. While Cormack claims that this figure represents Nonosabasut after being shot and killed, Shanawdithit insists that two men were killed that day—the second being Nonosabasut's brother, who also came to Demasduit's aid.
Positioned between this tragic scene and the initial surveillance of the Beothuk camp is a pair of figures, one red and one black, which has been interpreted as Demasduit and one of her Canadian captors—perhaps Peyton himself. The man is leading her away from the home that she would never again see alive.
We have not yet remarked upon the textual annotations that surround Shanawdithit's drawings, nor have we explained the provenance of this particular version of the map. This map is not the original, which was created in 1829; it is a copy from the early twentieth century, created by a Canadian government official and geographer named John Howley for his own book, The Beothucks or Red Indians, in which Peyton's narrative also first appears. As for the annotations, they were penned by Cormack, likely at the same time that Shanawdithit set her own lines to the page. But they, too, were edited and rewritten by Howley, which becomes clear when the two sets of annotations are placed side by side.
This is colonial knowledge extraction laid bare, as Cormack's own words confirm. "I keep her pretty busily employed in drawing historical representations of everything that suggests itself relating to her tribe, which I find is the best and readiest way of gathering information from her," as he wrote in a letter to the Bishop of Nova Scotia in January 1829. Cormack's sense of entitlement is here apparent, both in his stated goal of "gathering information" from Shanawdithit rather than provide comfort as her health declined, and in his palpable pride at having identified the "best and readiest way" to extract her knowledge from her.
When the idea of colonial knowledge extraction is discussed, it is often viewed as an abstract term—a signifier to be mobilized. But as Cormack's word remind us, the colonial extraction of Indigenous knowledge begins with very real people and actual events. On the map, Cormack's handwriting encircles Shanawdithit's drawings, registering not one but two forms of information. First and most obviously is the "information" about the Beothuk that it attempts to translate from image into text. But second is the information that it registers in and of itself: about the power that Cormack held over Shanawdithit as her captor, and about that process of knowledge extraction that framed the production of the map.
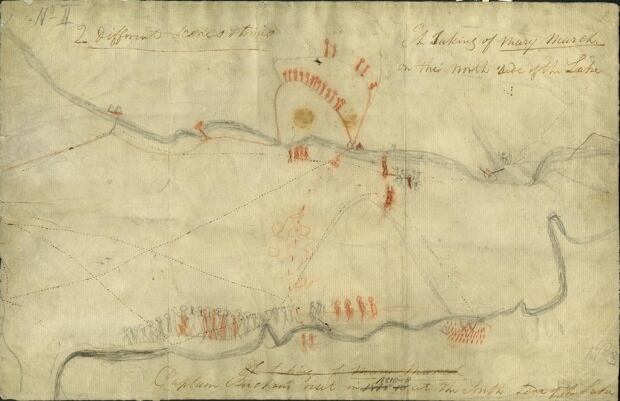
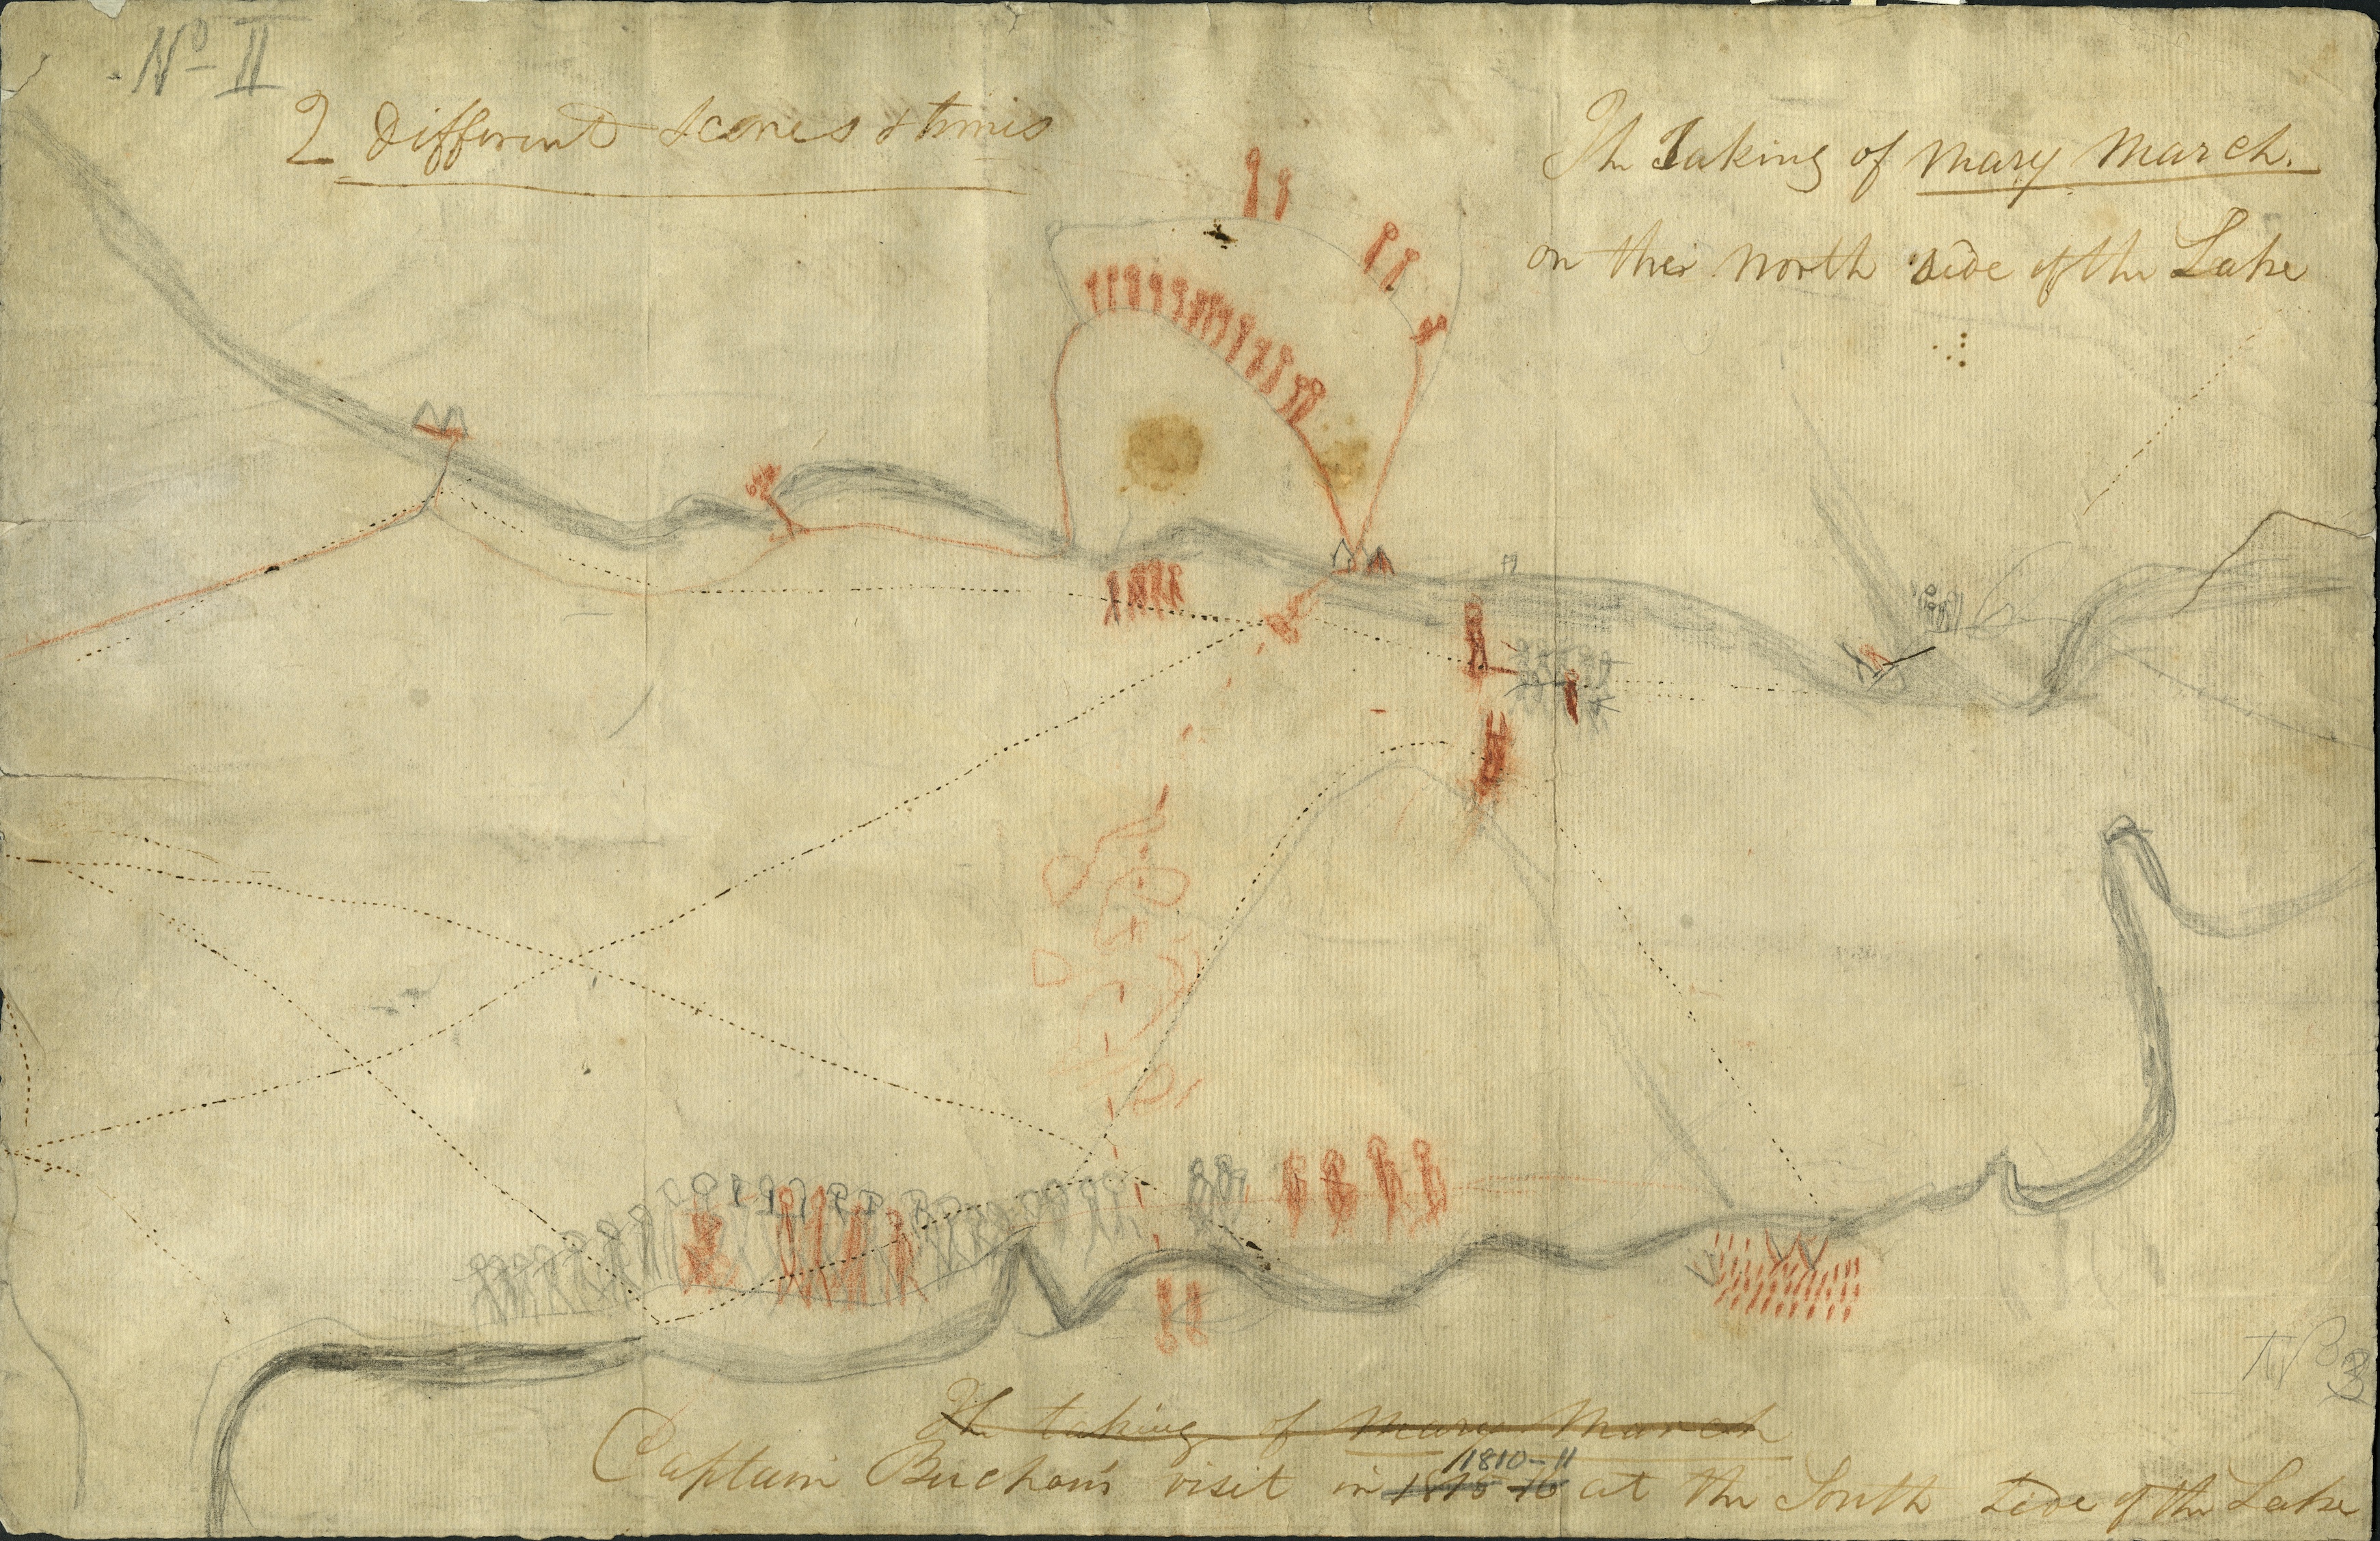
This framing of colonial knowledge extraction is necessary context for understanding the significance Shanawdithit's map, at least from a settler perspective. This is the reason we have withheld the image of the original map until this point. Viewing the two versions side by side confirms how Howley, too, participated in this process of knowledge extraction, albeit once removed. Consider his decision to smooth out Shanawdithit's shading of the riverbanks, for example, which have the effect of smoothing out the markings that more directly link Shanawdithit to the map she created. Or consider his editorial decision to remove the erroneous words that Cormack first recorded and then crossed out. These editorial choices demonstrate Howley's own sense of entitlement to Shanawdithit's knowledge, and his view of it as ethnographic "information" that could be easily severed from its source.
As designers and viewers of data visualization, we too perpetuate this process of knowledge extraction—more than we are likely aware. We often scoop up data without regard for its provenance, failing to consider any obligations we might have to the people who created it, or to the people whose lives it records. We similarly presume that our designs should be aimed at encouraging deeper exploration. It would not be incorrect to assert that the mantra of "overview first, then zoom, then details on demand" remains a first principle of visualization as a field. But this process runs the risk of enabling further knowledge extraction, rather than reminding users that most new knowledge comes with costs. How might we design an interface that encourages contemplation? What might a reparative treatment of Shanawdithit's map entail?
These are not easy questions to answer, nor do we claim to offer a definitive response. But as we work through our thinking on this matter, Cormack's handwriting becomes instructive once more. His crossed-out words and phrases show just how much he—the translator of Shanawdithit's knowledge—strained to understand the events that he was looking at. It is additionally revealing that Howley chooses not to reproduce Cormack's errors in his version of the map, as it enables him to elide Cormack's haziness with respect to the very history that he sought to preserve. But in the original, Cormack's handwriting endures as a marker of the original conditions under which Shanawdithit created her maps—and as a reminder to us of our complicity in a process that has yet to fully unfold. As we weigh our own decisions about what information to convey, and what to set to the side—both with respect to this particular visualization, and with respect to vis more broadly—we must return to our obligations to our sources and the people who produced them, as well as to the colonial context in which our research in the present necessarily takes place.

As the previous discussion has (hopefully) shown, we cannot view Shanawdithit's map as an unmediated expression of her worldview. And yet, many of her design decisions are informed by elements of Indigenous mapmaking practice, which are helpful to unpack for how they help to attune us to ways of knowing outside of our own. The idea of "Indigenous mapmaking practice" is of course loose term, spanning cultures and continents, medium and genre, as critical cartographer Margaret Pearce (Potawatomi) explains. In her summation of these practices, Pearce invokes examples that range from "Hawaiian performative cartographies to Navajo verbal maps and sand paintings and the Nuwuvi Salt Song Trail," emphasizing how Indigenous maps may be "gestural, chanted, or inscribed in stone, wood, wall, tattoo, leaf, or paper," and may be enlisted to a variety of ends: "to assess taxes, guide a pilgrim, connect the realms of the sacred and profane, or navigate beyond the horizon," she explains (110). What binds these examples together, for Pearce, as for other scholars of Indigenous cartography, is how they are understood as part of a larger process of knowledge-making, rather than as a definitive source of what exists, or what is true. This process is premised on relationships among people as well as places, relationships that continue to acquire meaning as they unfold.
We see this temporal point of view emerge in Shanawdithit's decision to depict a series of events, transpiring over decades, in the single place of Red Indian Lake. We can also perceive its difference from the spatial perspective that was (and remains) characteristic of colonial mapping practices in Cormack's difficulty in determining what it is, precisely, that Shanawdithit has drawn. He crosses out an incorrect label, "The Taking of Mary March," which he first positions on the south side of the lake, and rewrites in its proper location on the north side. He also adds in a clarifying note at the top left of the map, just below the reference number he has provided: "2 different Scenes & times." The note is underlined for emphasis. It appears that Cormack requires this explanatory note in order to remind himself of what it is that is depicted, even as the two scenes are easily linked in Shanawdithit's mind. Another hallmark of Indigenous cartography emerges through Shanawdithit's decision to include both human figures and geographical features on her map. This is what Pearce characterizes as an emphasis on place as it is experienced "as opposed to the Western convention of depicting space as universal, homogenized, and devoid of human experience." Settler geographer Matthew Sparke, who has commented directly on Shanawdithit's maps as examples of Indigenous cartography, observes how even the symbolic components of the map, such as the paths across the lake, push back against Western orthodoxies of space and scale. By depicting "the uneven possibilities of travel by foot across uneven landscape," Sparke suggests, Shanawdithit incorporates an embodied dimension into the elements of the map that would otherwise be interpreted only for the geographical information that they convey (324).
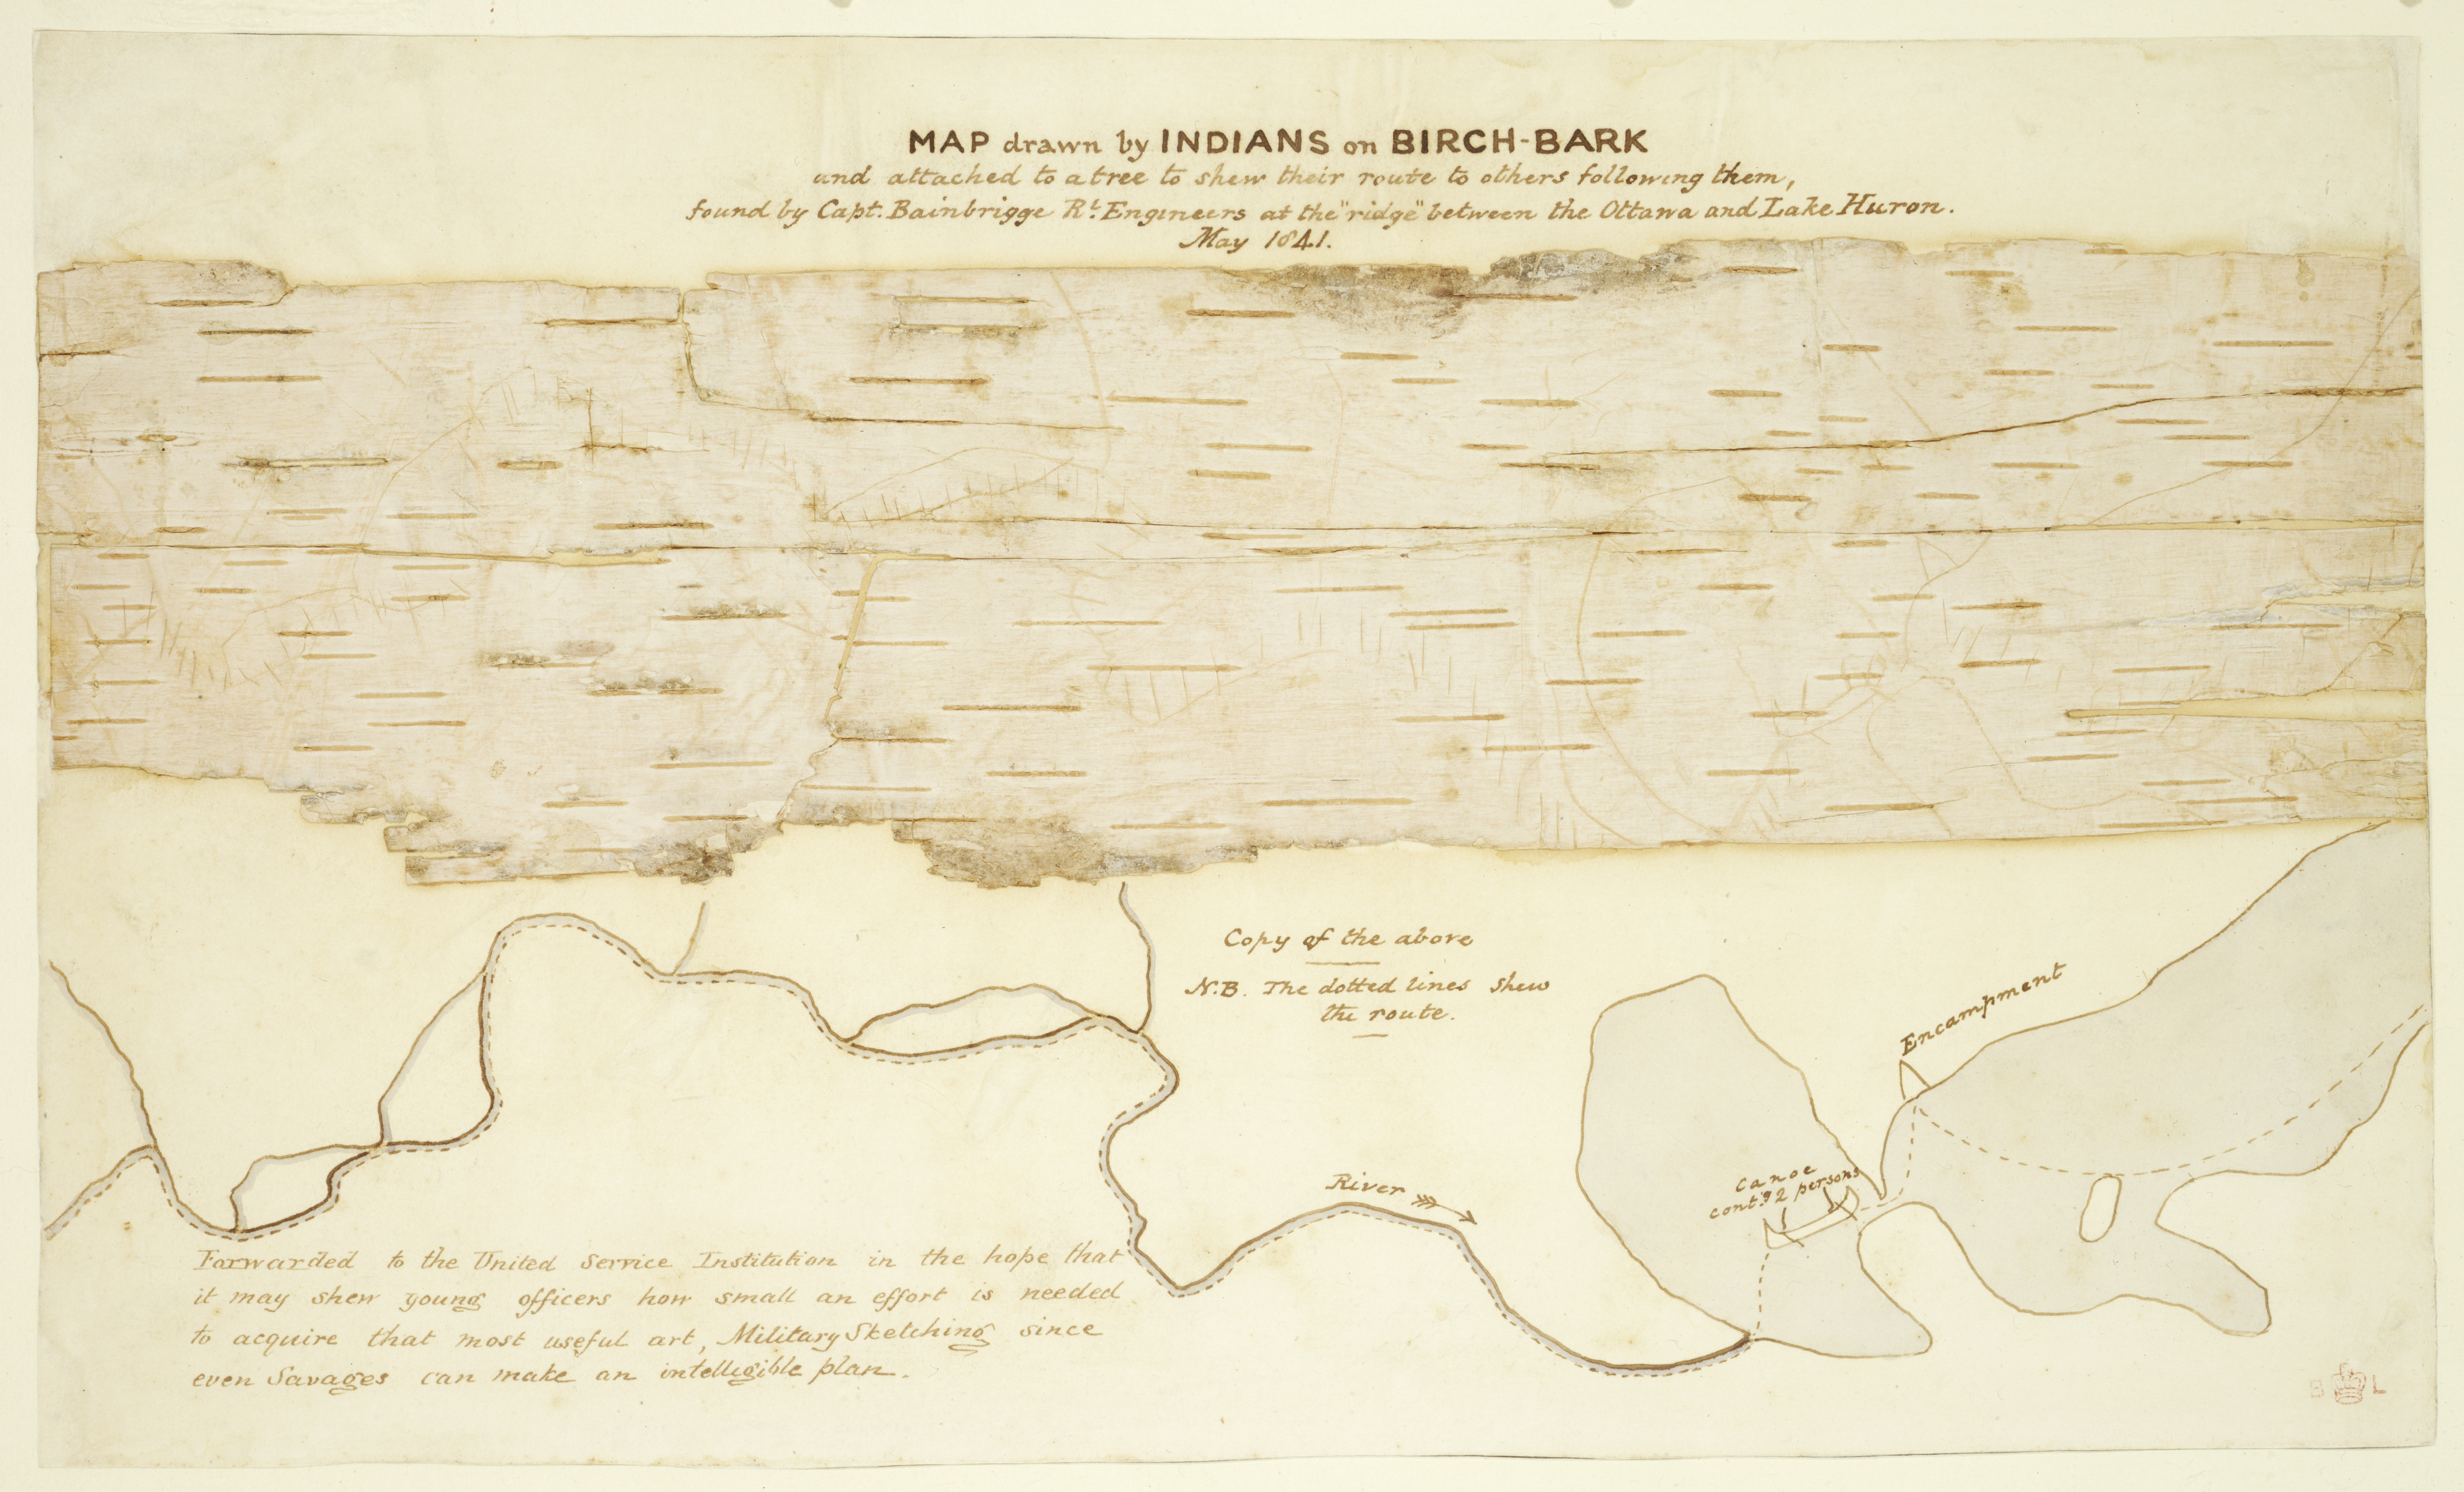
[[ CUT??? Extending Sparke's reading, Fiona Polack finds in the footpaths a direct challenge to the colonizing function of Western cartography—and in particular, to colonial maps made of the North American continent. Whereas those maps enforce "the myth of terra nullius" by plotting only geographic features, such as mountains or rivers, Shanawdithit's decision to also include human-made footpaths provides evidence of "repeated Indigenous journeys across [the] territory" (2013). In this way, Shanawdithit's maps make it impossible for their viewers to conceive of the land without the people—her people—who had first inhabited it. ]] But of course, Shanawdithit was not simply drawing her people; she was also drawing herself. The documents that attempt to preserve Shanawdithit's knowledge for the page, including narratives by both Cormack and John Peyton Jr., make repeated mention of how Shanawdithit "was present" during each of the encounters with the British. It follows, then, that Shanawdithit was herself represented by one of the thirty-seven tick marks on the south side of the lake, and again on the north side as one of the figures in red that sought shelter in the woods. She may have been recording "information" about her people, to return to Cormack's words, but she was also recording her own story—one that included certain triumphs, but was ultimately shaded by trauma and loss. One further detail underscores this point. The art historian Nicholas Chare, who has written on Shanawdithit's maps through the lens of trauma studies, locates in a note written by Cormack the otherwise unremarked upon fact that Shanawdithit "received two gunshot wounds at two different times, from shots fired at the band she was with by the English people at Exploits," and that "one wound was that [of] a slug or buck shot thro[ugh] the palm of her hand" (294). While it is unknown which hand Shanawdithit employed to draw her sketches, "it may well have been the hand she sketched with," Chare suggests. Regardless, the wound serves as a physical reminder of how the colonial violence that led to the capture of Shanawdithit—and, ultimately, the destruction of her culture and kin—was the very same that led to the creation of her maps. [IMAGE OF EARLY BIRCH BARK MAP AND/OR SARAH SENSE REENAGEMENT ]
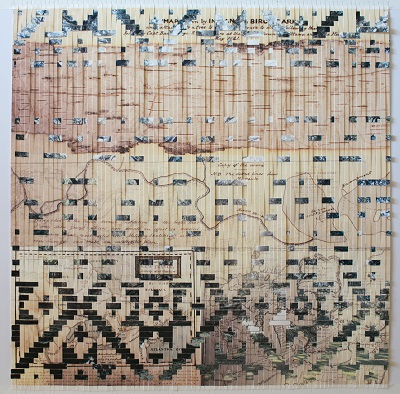
By excavating the layers of colonial violence that surround Shanawdithit's creation of her map, we are further guided by the approach of literary scholar Mishuana Goeman (Seneca), who emphasizes the importance of "examining the theoretical dimensions of power" so as to resist the "utopian" yet ultimately impossible goal of recovery (4). No magnitude of desire or strength of effort, as Goeman explains, can gain us access to "an original and pure point in history," nor can we ever fully account for colonialism's ongoing effects (4). The most generative form of knowledge we might pursue, Goeman suggests, and which this chapter sets as its goal, is an understanding of "the relationships set forth during colonialism that continue to mark us today" (4).
Goeman's point of departure, like ours, is the map because of how closely maps and mapping are tied to the production of colonial power. Maps can literally create nations and dismantle others— a lesson that most Indigenous inhabitants of Turtle Island had learned well before the encounter between the Beothuk and Peyton and his men. Consider the example of the so-called "Walking Purchase," which dates to 1737, nearly a century before Shanawdithit set her maps to paper, when the Lenape leader Teedyuscung agreed to sell a parcel of land to the Penn family (of the then-colony of Pennsylvania) that was bounded by the distance that a man could walk in a day and a half. After the treaty was signed, the Penns' agent cleared a trail through the land and hired three of the fastest runners he knew to run along it, resulting in the Lenape ceding a swath of land twice as long as was initially envisioned. In response to the "fraud," as Teedyuscung himself called it in his report to colonial officials, he subsequently "insisted on drawing his own map to delineate [the Lenape] territory and solidify their rights," as Lisa Brooks (Abenaki) explains.
Or, consider the end result of a seemingly innocuous encounter between Ac ko mok ki, a Siksika leader, and a surveyor for the Hudson Bay Company named Peter Fidler, which took place at an outpost at the juncture of RIVER and RIVER, just east of what is now known as Alberta. At the time, however, the outpost represented the frontier of colonial knowledge as well as settlement. When asked by Fidler about what lay further north and west, Ac ko mok ki traced in the snow— from memory—a map of more than 200,000 square miles of the continent, narrating the features of the map as he drew. Fidler then copied the map onto paper "reduced ¼ from the original," annotated it with the information he'd heard Ac ko mok ki speak aloud, and then sent the map back to the headquarters of the Hudson Bay Company in London. Ac ko mok ki's knowledge was then incorporated into the map of the continent that the Hudson Bay Company had been preparing, and which three years later would be used by Lewis and Clark to determine the route for their nation-marking mission.
!["An Indian Map of the Different Tribes that inhabit on the East & West Side of the Rocky Mountains with all the rivers & other remarkbl. places, also the number of Tents etc. Drawn by the Feathers or Ac ko mok ki -- a Black foot chief -- 7th Feby. 1801 -- reduced 1/4 from the Original Size -- by Peter Fidler." A sketch of the tribes which reside on the East and West sides of the Rocky Mountains. Each tribe is depicted as a circle on the map written next to a number, and a key in the top left corner describes the name of each numbered tribe with a corresponding number of tribe members [CHECK]. The left side of the map shows six lines that slope down and to the right, which the right-hand side imperfectly mirrors, meeting, assumedly, at the peak of the mountain. A horizontal divider between the key and the map stretches across the page, with various letters of the English alphabet marked along it, corresponding to another key on the bottom right corner of the map. Next to the key on the right are more circles and lines to indicate tribes that reside farther away from the central peak depicted. In the bottom left-hand corner, there is an annotation by Fidler that notes how many days it takes to travel between the numbered locations.](/images/shanawdithit/fidler-large-HBCA-E3-2-225.jpg)
For the Indigenous knowledge that they consistently capture, and the dispossession continually they leave in their wake, maps like the Hudson Bay Company's might be understood as weapons -— weapons of map destruction, to adapt a phrase from Cathy O'Neil—producing colonial nations just as effectively as they reproduce the power on which colonialism depends.
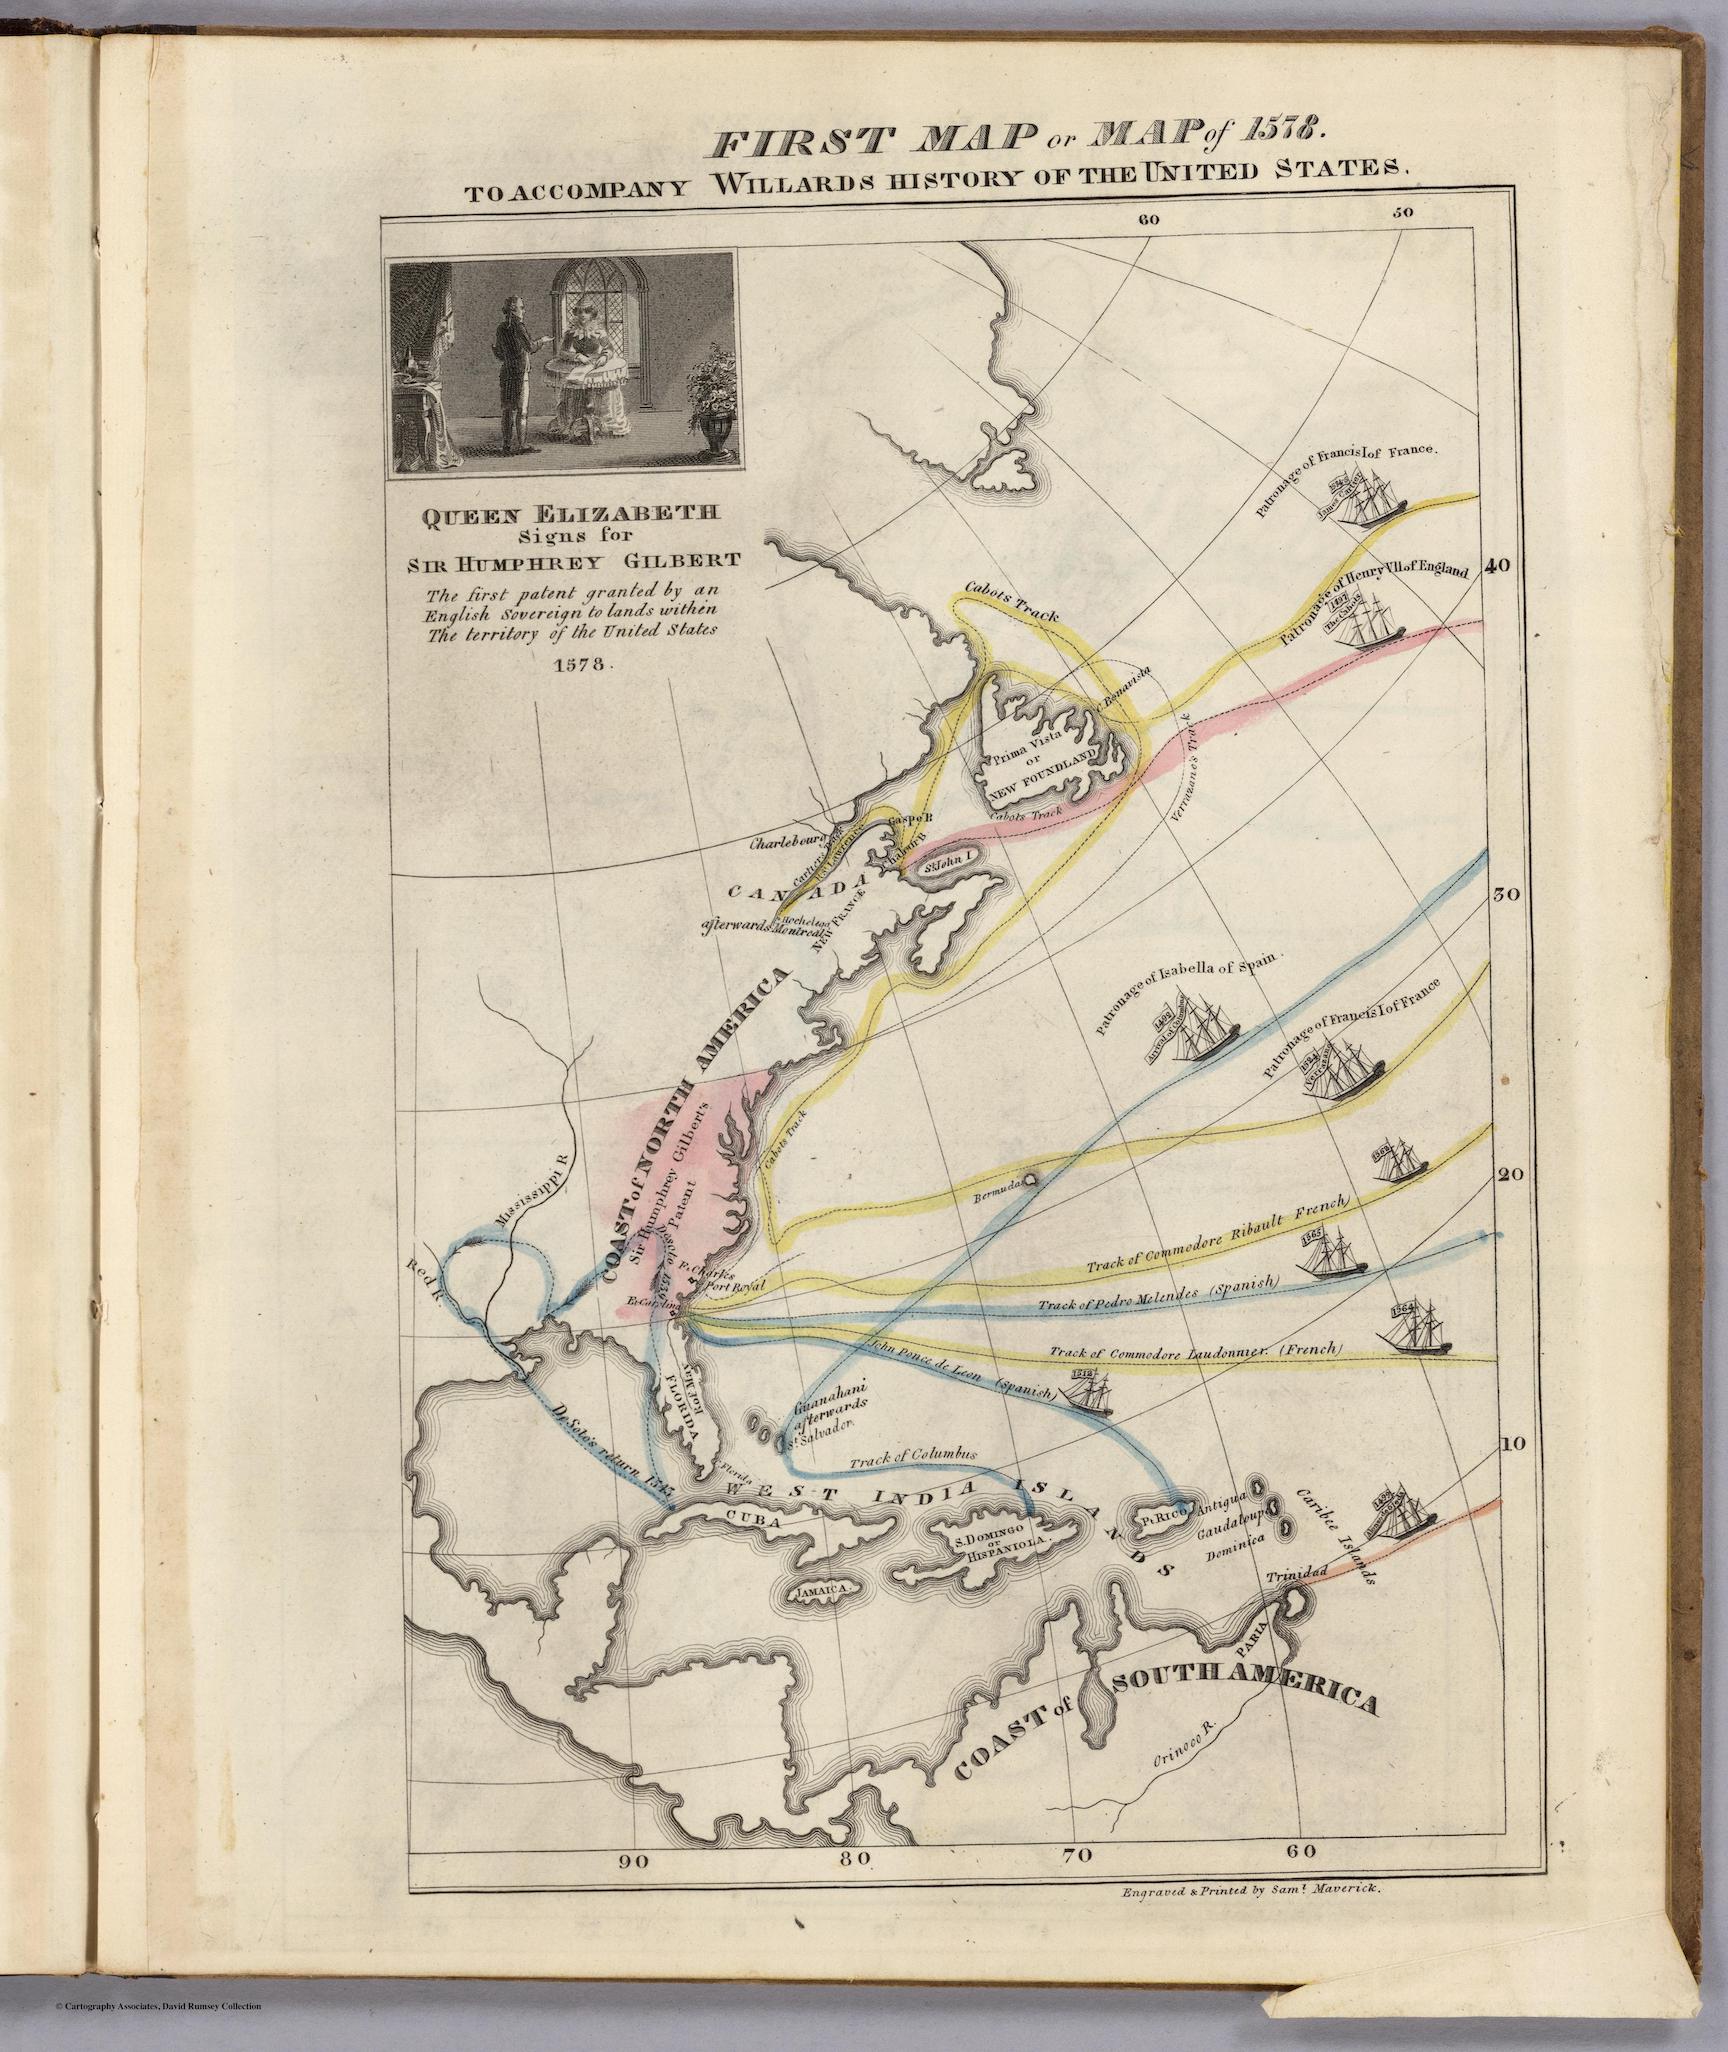
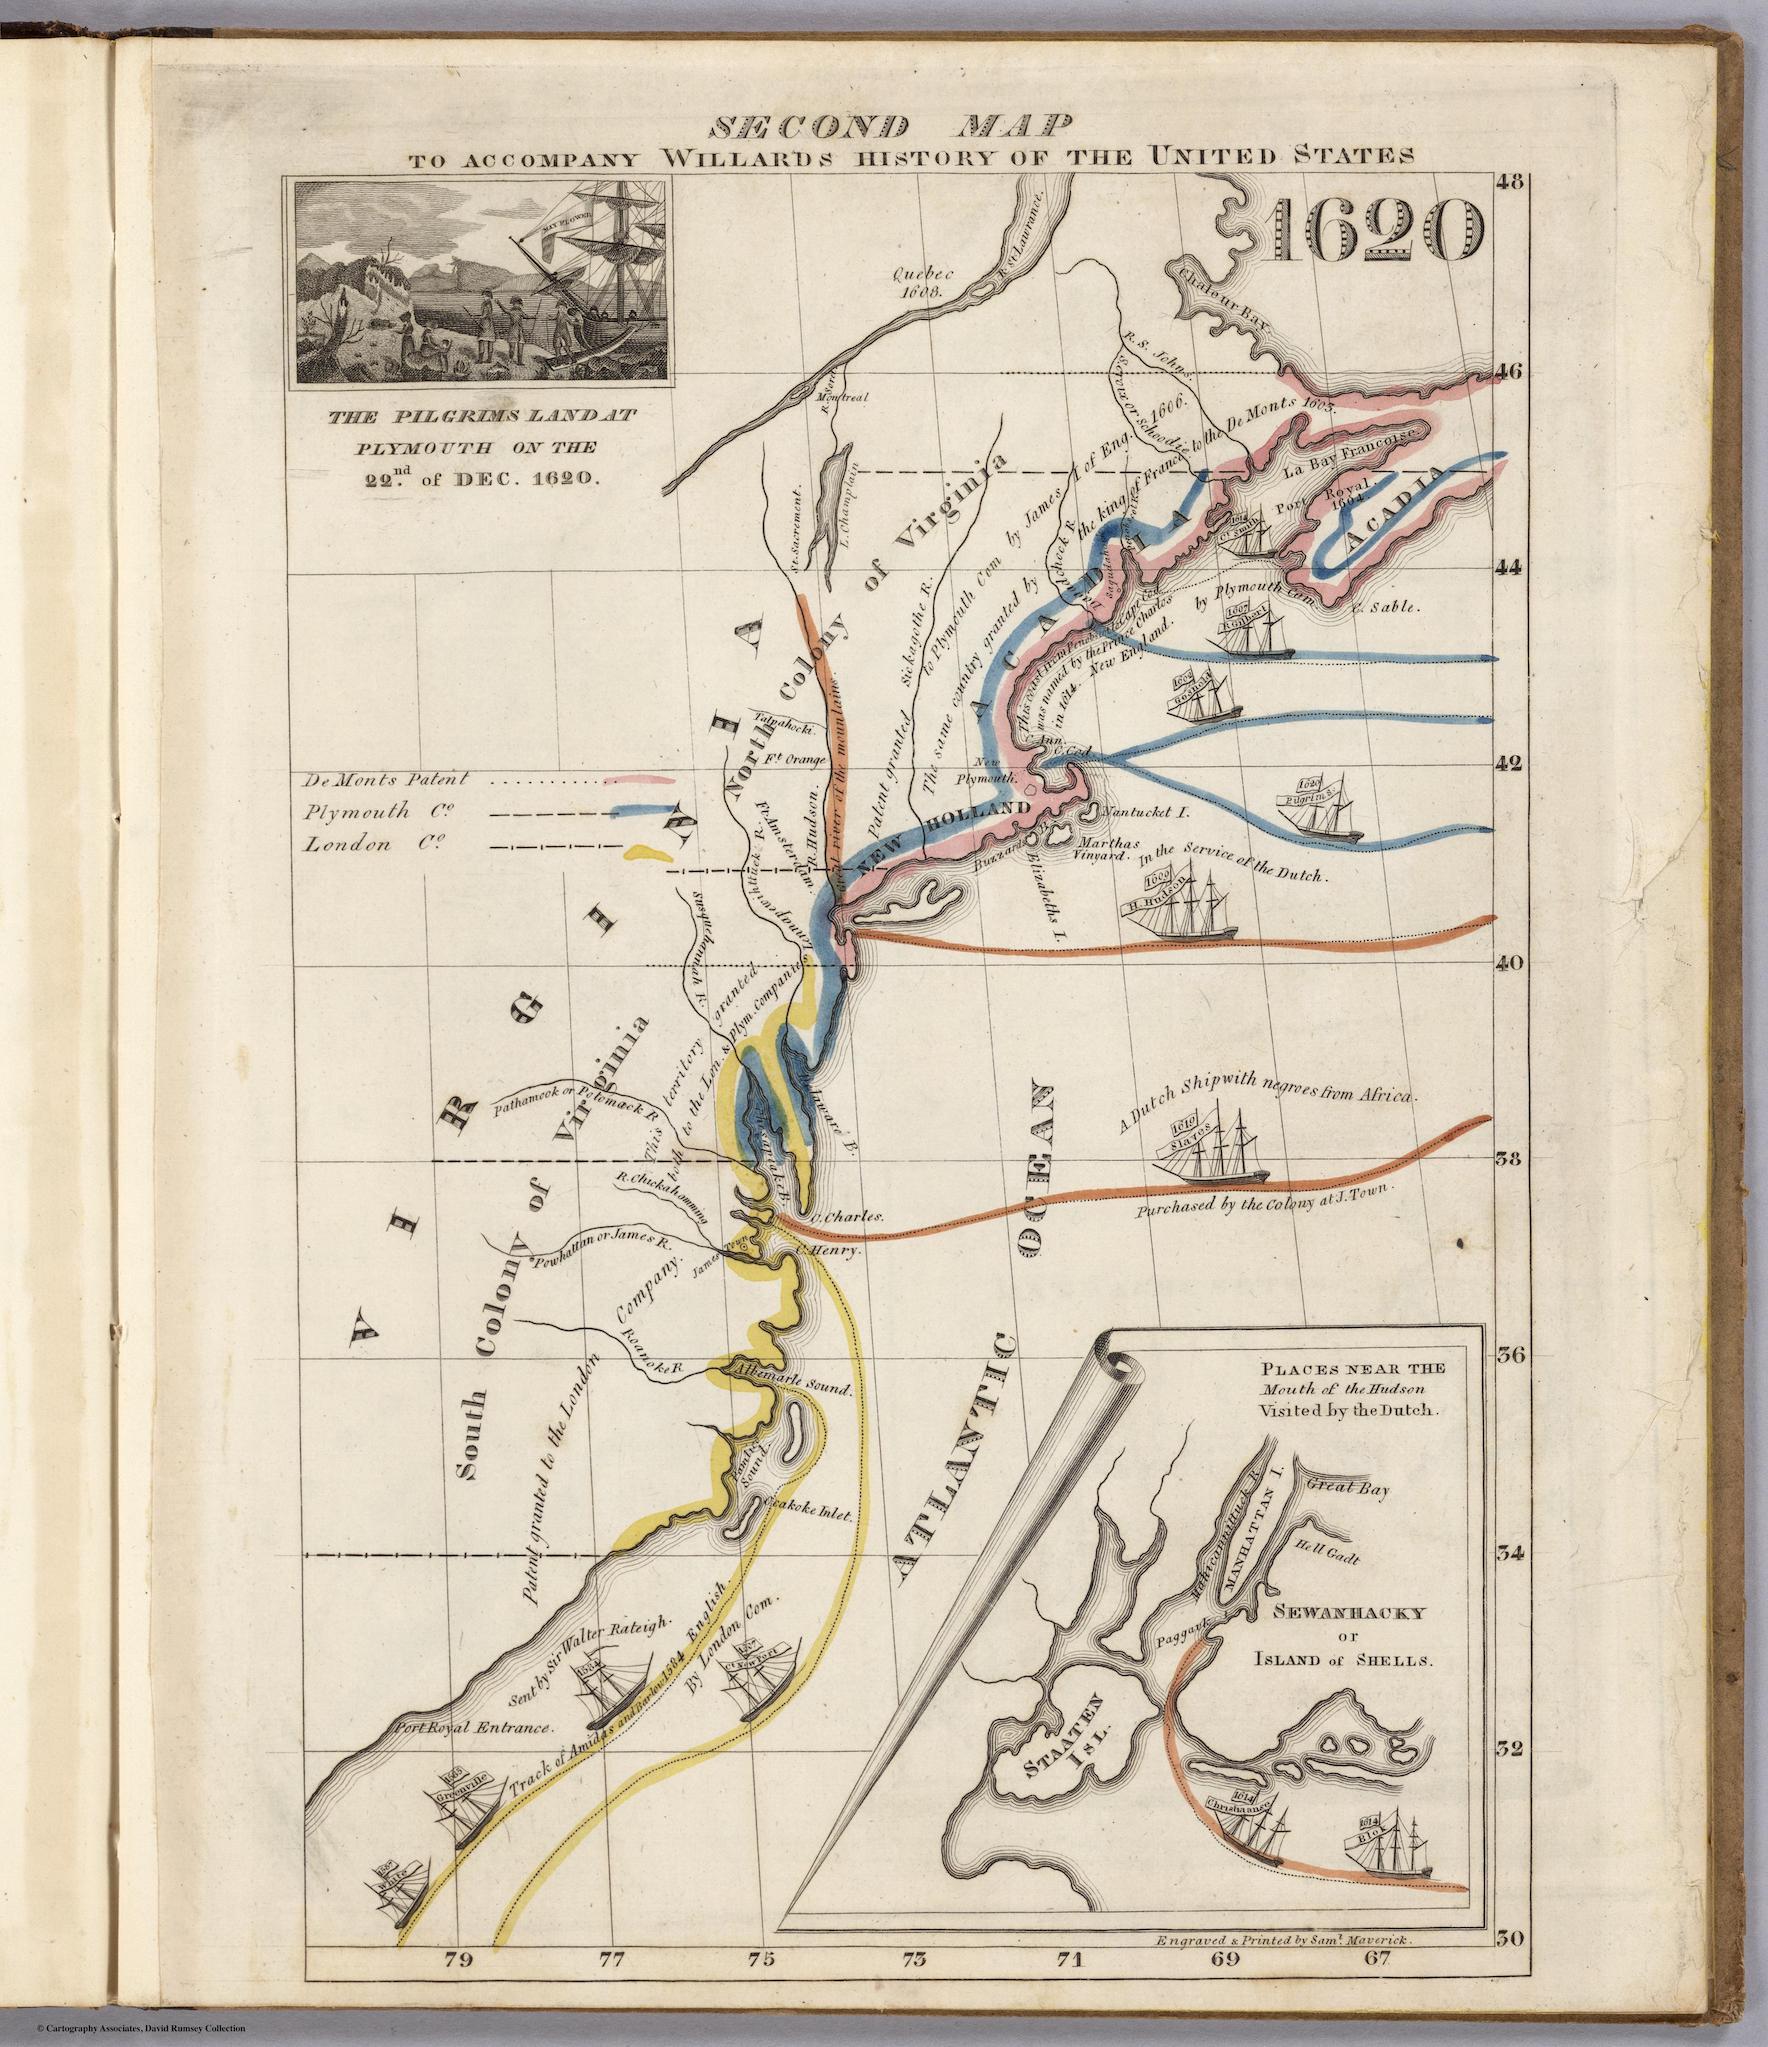
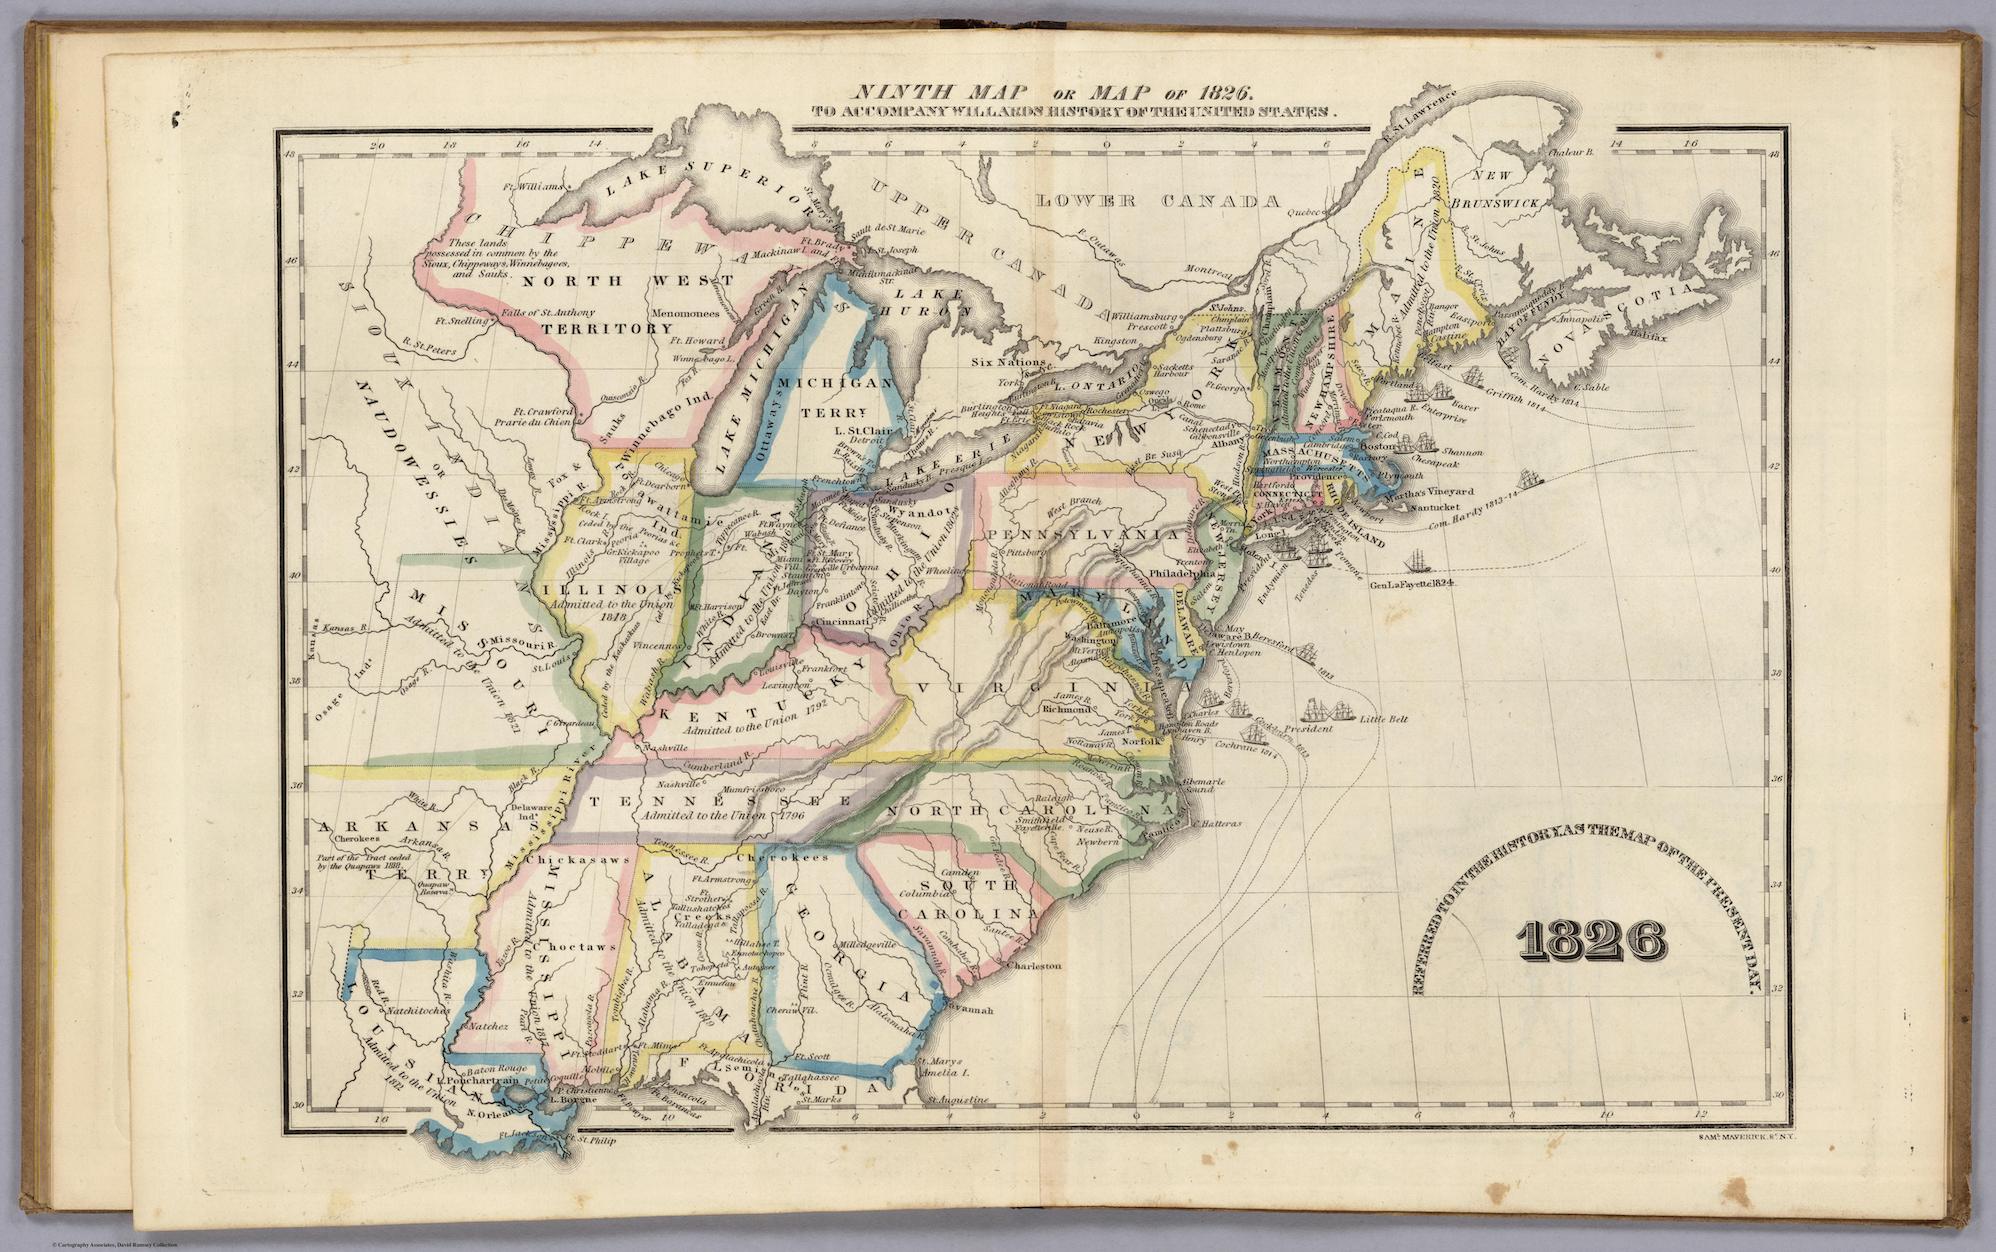
Colonial maps do not only define the borders of new nations; they also define the stories those nations require to grow. At the very same time that Shanawdithit was committing the story of her people to paper, for example, a settler woman by the name of Emma Hart Willard was mapping a new narrative for the United States. The Connecticut-born Willard, an educator and activist, designed her maps to accompany her US history textbook, History of the United States, or TheRepublic of America, which was published in 1828. Whereas Shanawditith, at that time, was documenting the near-complete destruction of the her world, Willard was scaffolding a story of American national emergence.
From the "First Map""First Map" of 1578, which depicts the routes taken by European explorers—including John Cabot to Newfoundland, where he likely encountered the Beothuk—to the "Second Map""Second Map" of 1620, which depicts the colony of Virginia along with an inset documenting the Pilgrims' landing at Plymouth Rock, and on to the final "Ninth Map""Ninth Map" of 1826, which are told represents the present day, Willard presents a "cumulative statement of nationhood," as historian Susan Schulten (settler) describes it, one which enlists the knowledge-producing power of the map in the service of a national origin story. This story, as Willard herself explained in the preface to her book, would connect otherwise isolated events in history "by some common tie," and as a result, "contribute much… to the growth of wholesome national feeling."
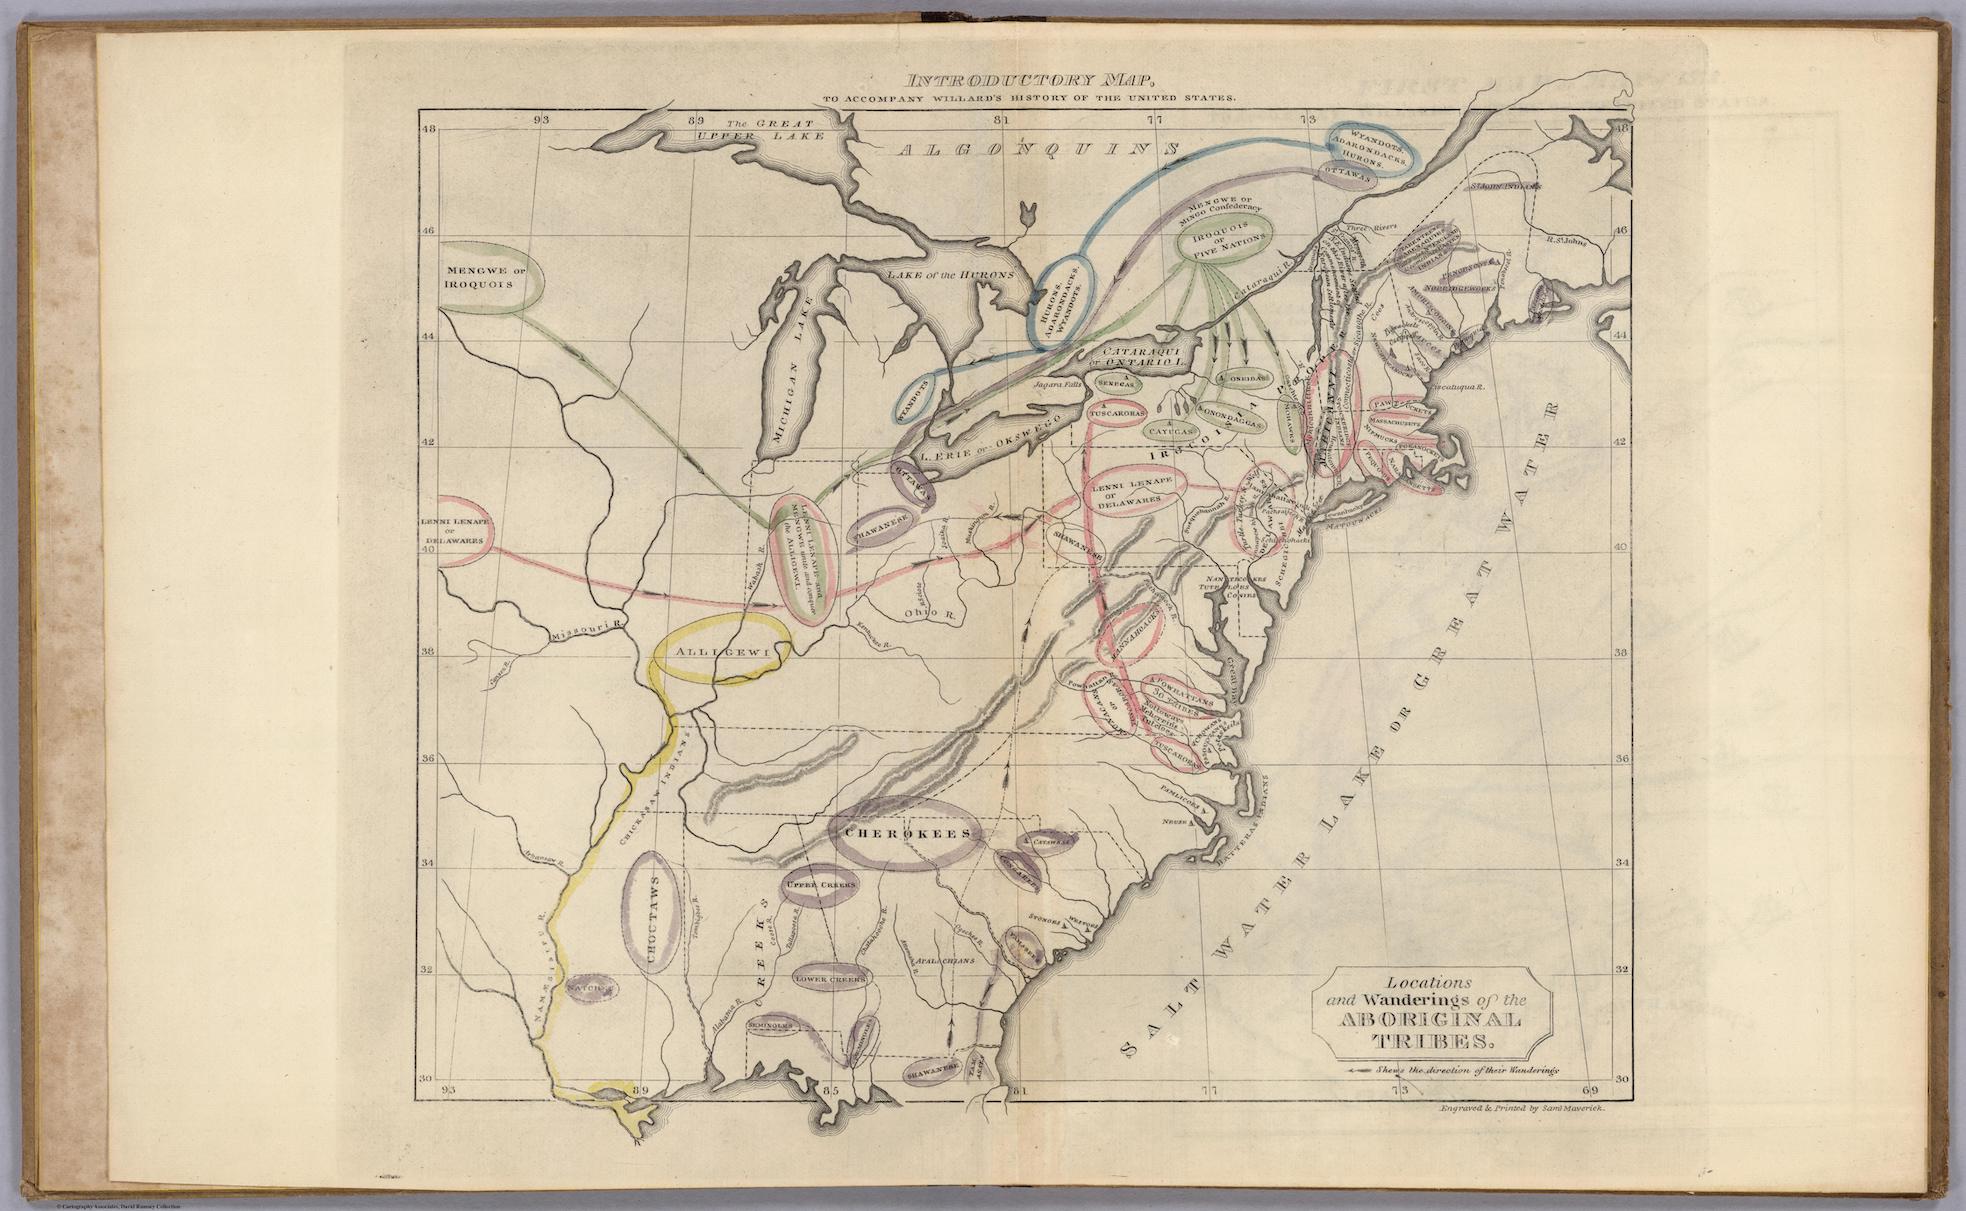
One part of this "wholesome national feeling" was the new narrative that the maps provided about the emergence of the United States, which we will return to in Chapter 3. But this national feeling was premised on the removal of any Indigenous nations that might complicate its upward growth. In this context, it is notable that the only map to reference Indigenous people or nations is the textbook's "Introductory Map," which is subtitled "Locations and Wanderings of the Aboriginal Tribes." On this map, Willard places labels in the approximate locations of each Indigenous nation or tribe that she knew. She also circles each of the tribe's names, with the size of the circle indicating its "size and relative influence." The color of the circles and the lines connecting them indicate affiliation or "migration," in Willard's terms, although it is more accurately described as displacement.
Introductory Map, which is subtitled Locations and Wanderings of the Aboriginal Tribes.
On this map, Willard places labels in the approximate locations of each Indigenous nation or tribe that she knew.
She also circles each of the tribe’s names, with the size of the circle indicating its “size and relative influence.”
The color of the circles and the lines connecting them indicate affiliation or “migration,” in Willard’s terms, although it is more accurately described as displacement.
“Salt water Lake or Great Water.”
The perspective inhabited by the map is peculiar. On the one hand, Willard chooses to label certain waterways with names that seem chosen to convey an Indigenous worldview. Instead of the Atlantic Ocean, for example—the label that appears on subsequent maps—that body of water is here labeled "Salt water Lake or Great Water." Yet her choice to present this map as an "Introductory Map," rather than incorporate Indigenous nations into a more complete (if not more "wholesome") story of the United States, as Schulten convincingly argues, "reinforced the contemporary assumption that Native Americans existed in a timeless space prior to human history" (25). Nations such as the Beothuk are not granted a place in the future of North America; only its past.
In addition to how they provide evidence of how mapmaking functioned as a means of producing colonial knowledge, Willard's maps are also instructive for how they more closely connect the maps in this chapter to the project of data visualization. While this relationship is a complicated one, and often contested, it is generally agreed upon that certain maps, which translate data into image, can be considered under the rubric of data visualization. For Willard, the decision to translate data into image was pedagogical—indeed, epistemological—choice. She consistently railed against numbers alone for being "hard to acquire, difficult to remember, and, standing by themselves, of little value when remembered," as she wrote with respect to her "Temple of Time," discussed later in this project.33 As an alternative pedagogical strategy, Willard seized upon the model of the "tableau physique," as popularized by the German naturalist and explorer Alexander von Humboldt (with A.G. Bonpland), as an example of how to "stimulate memory by visualizing information."
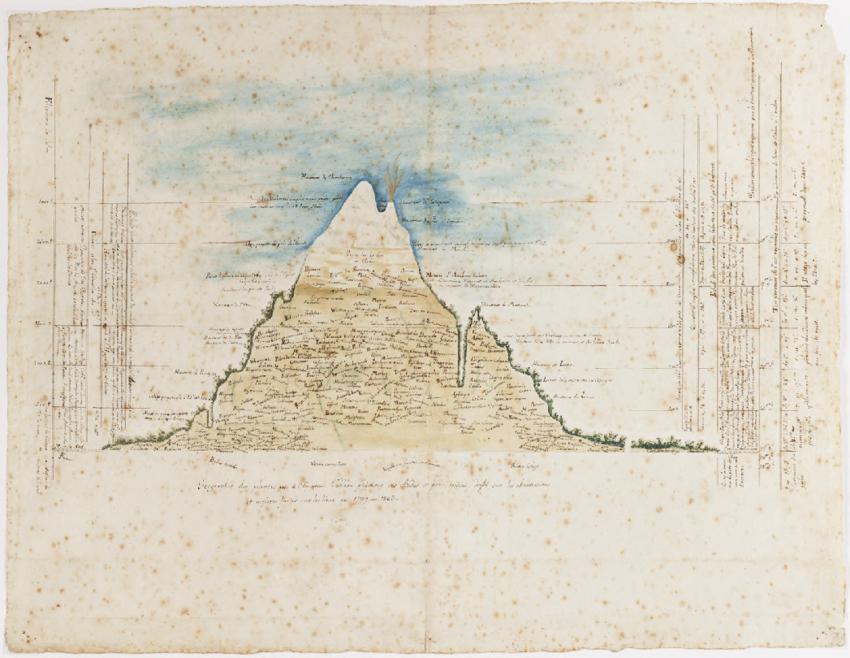
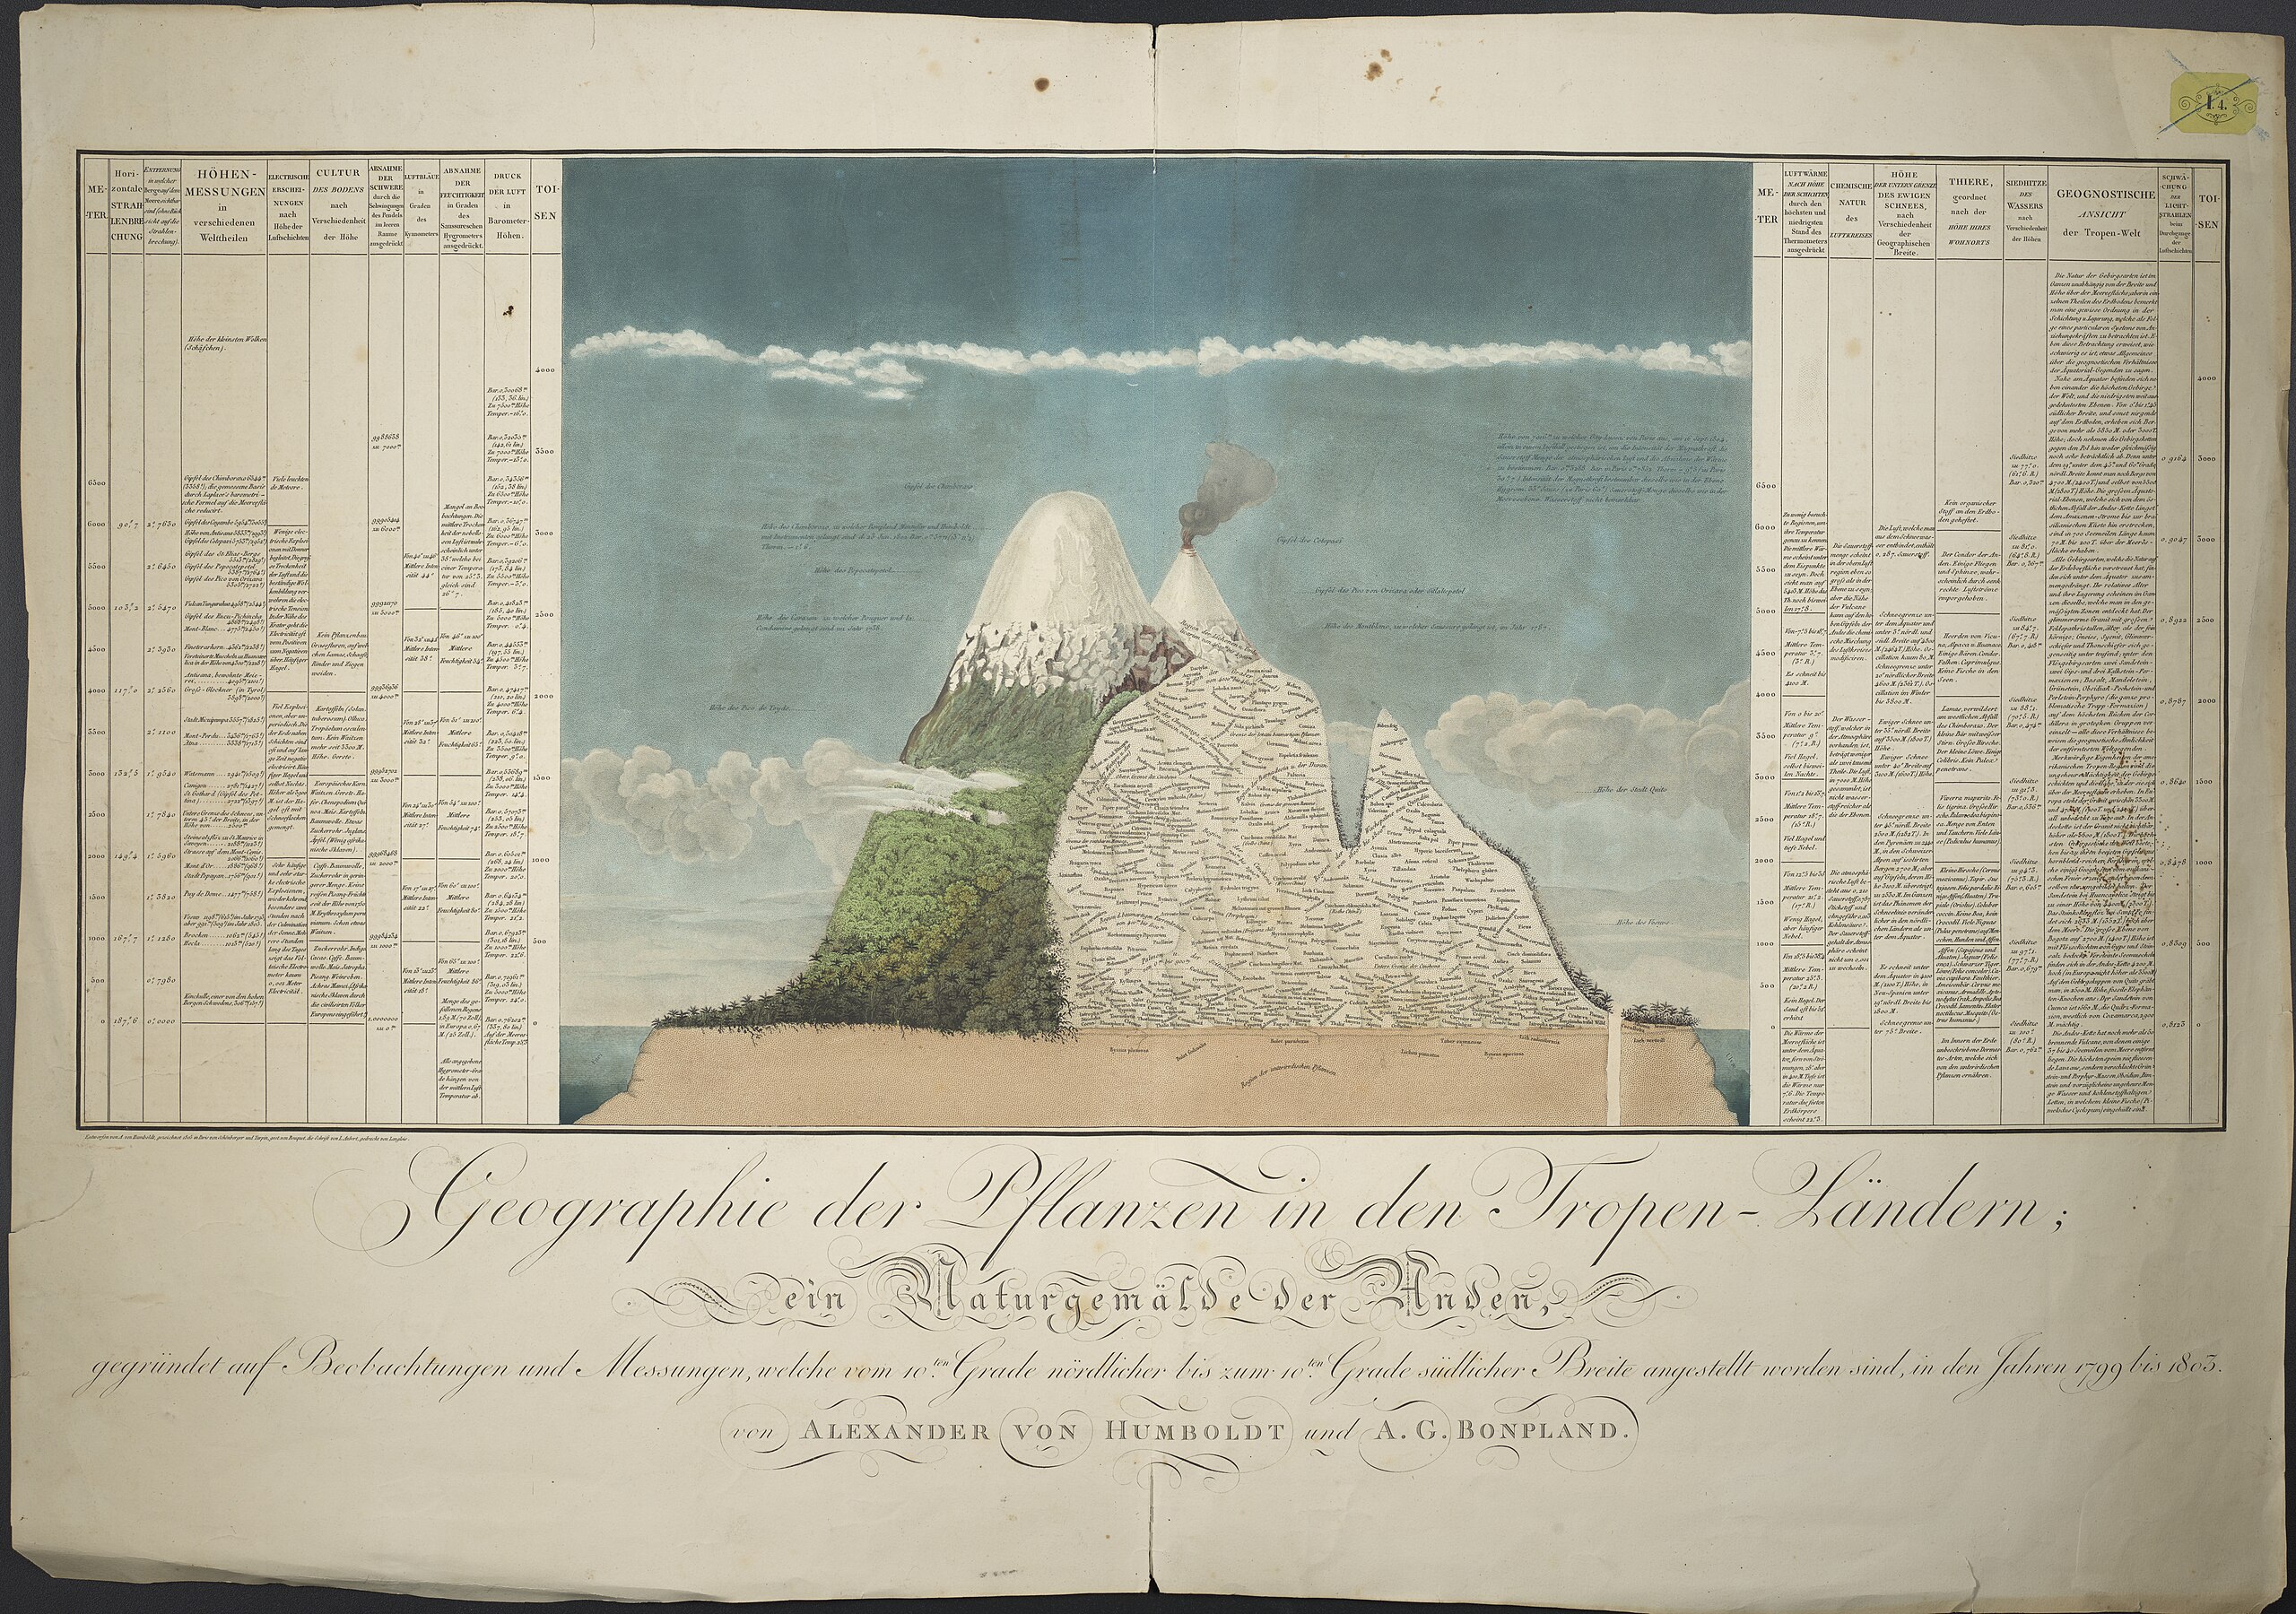
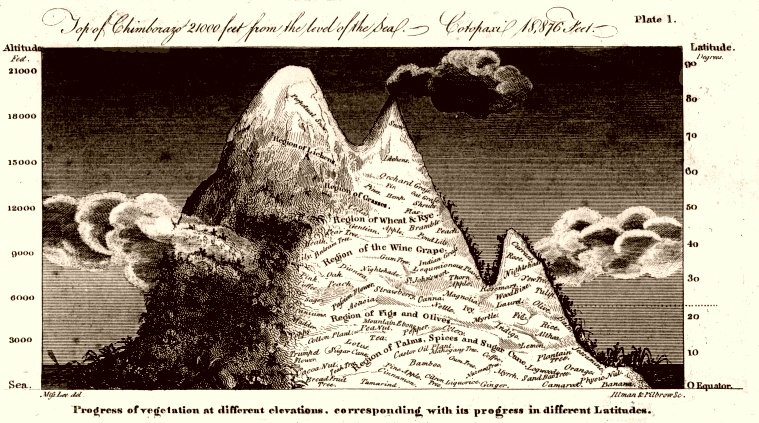
Whether this information had to do with species of plants that grew at specific altitudes, as in the Humboldt visualization reproduced in the botany textbook created by Willard's sister, Almira Hart Lincoln Phelps, who lived with Willard at the time; or the dates of key developments in the development of Western empire, which Willard would go on to visualize in the style of Humboldt and his Colombian antecedent, Francisco José de Caldas, several years after the publication of her textbook, in 1836, Willard believed that "facts" (as she termed them) would be better recalled if connected, visually, "by some common tie" (Willard, "History," vii). Here Willard anticipates the function of visualization that is consistently extolled by today's visualization researchers as enhancing our ability to detect otherwise imperceptible patterns in our data.
[ IMAGE OF CALDAS VIS, WILLARD PICTURE OF NATIONS ]
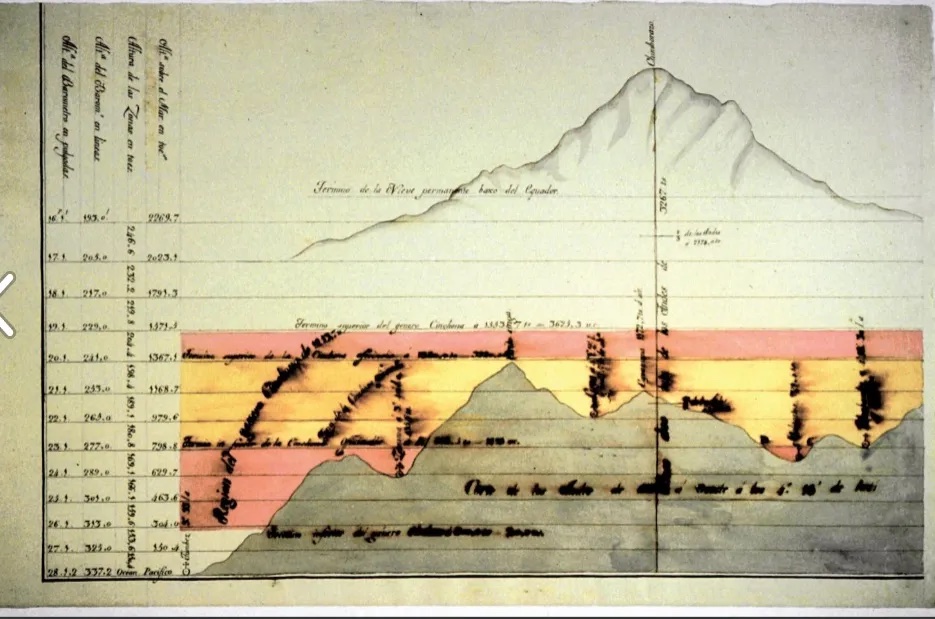
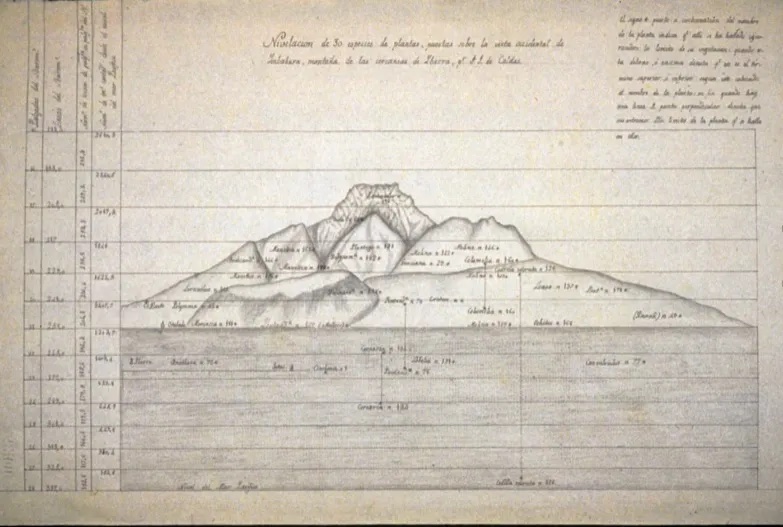
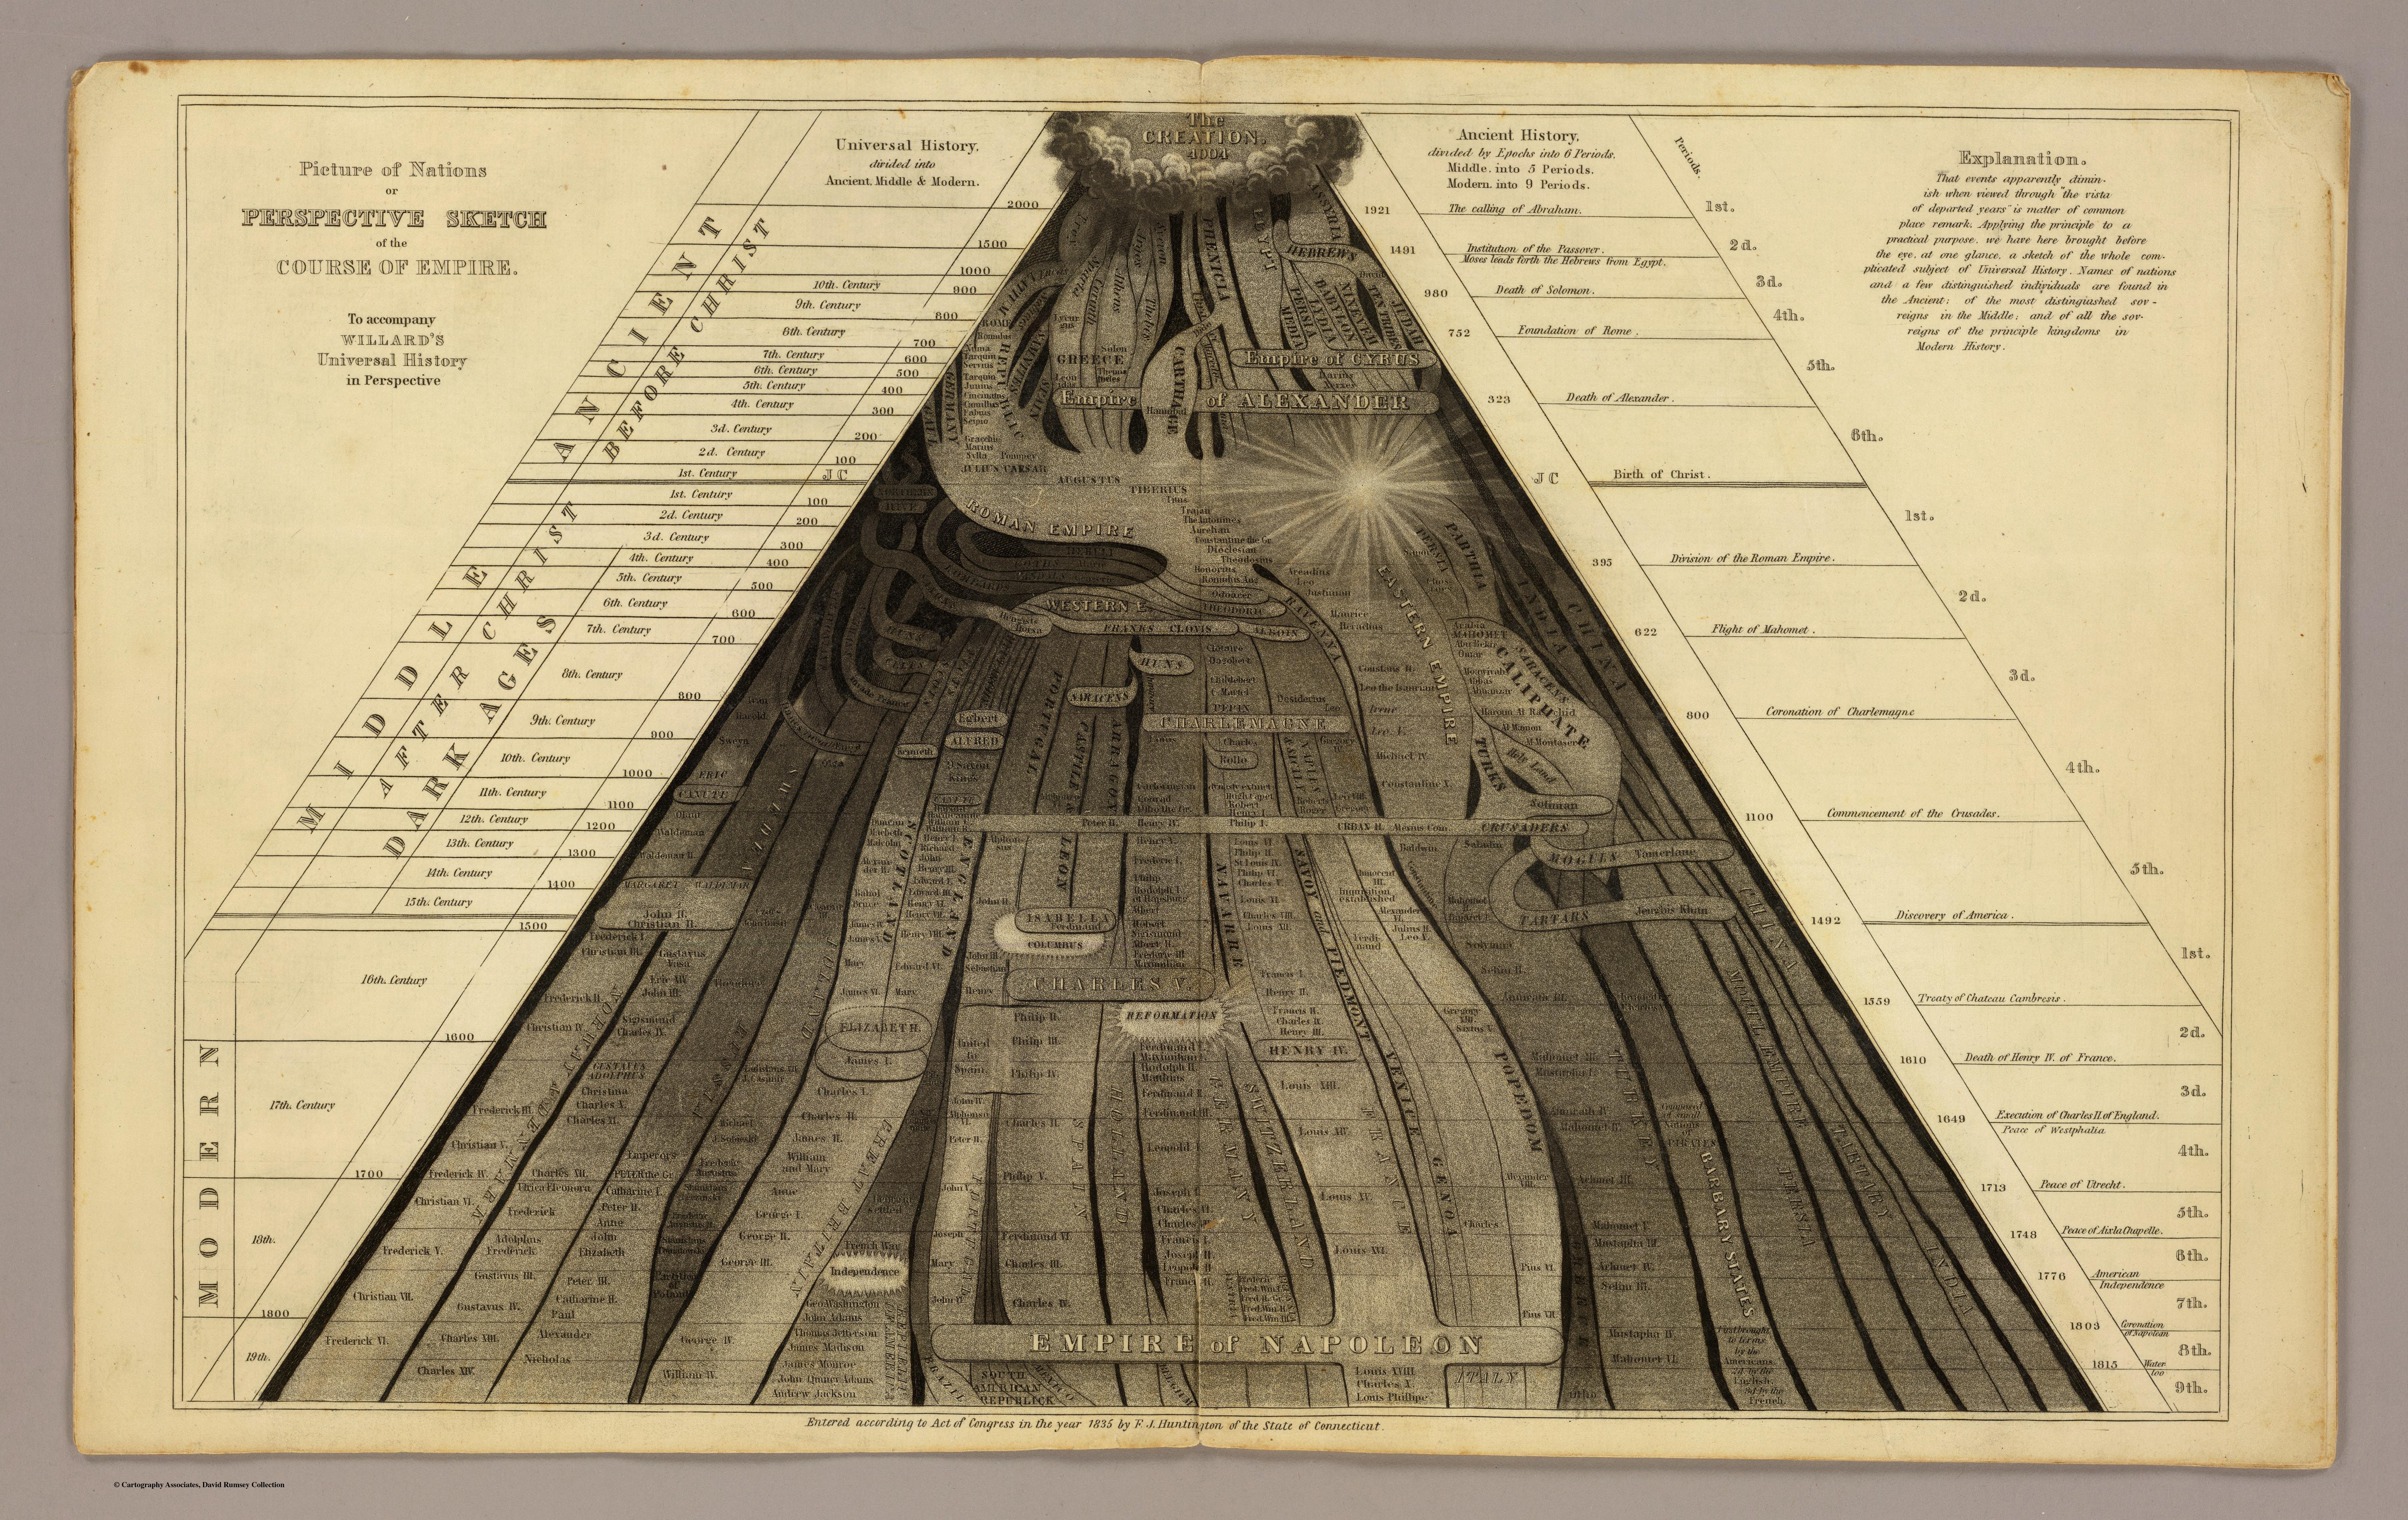
While the images above are perhaps more legible as data visualization than Willard's maps, it is worth considering the maps for the patterns and other analytical components that they do contain. In this regard, Bill Rankin's conceptualization of the "analytical map" is helpful, as it helps to distill the components of the map that are intended to identify the patterns that prompt insight, and those that are intended to be taken as the ground truth. In Rankin's formulation, the map is divided into a foreground and a background, where the background is the "'base data" that provides the geographic context for the map, while in the foreground are plotted additional data sources that serve as the analytical contribution of the map. As Rankin also observes, the choice of which datasets are placed in the foreground and which are placed in the background are just that—choices—and those choices are both rhetorical and political. In the case of "Locations and Wanderings of the Aboriginal Tribes," Willard places US state borders in the background of the map, enhancing their authority by presenting them as the literal ground truth on which Native peoples, past and present, are superimposed.
With an awareness of the foreground/background divide and the rhetorical significance of what information is placed where, it's worth returning to Shanawdithit's maps once again in order to contemplate an additional way in which they teach us about her worldview and its distance from our own. More specifically, Shanawdithit rejects the distinction between foreground and background, presenting people and place in a single visual plane. In doing so, she insists on her cultural as well as geographic authority. Her worldview is one that insists upon the connection of people to the land, and her map gives this relationality visual form. Viewing her map from a settler perspective, and at more than two centuries removed, we cannot know the exact stories that order these relations.37 But we can recognize—and respect—the visual evidence of an ordering practice outside of our own.
The Colonial Archive and the Lookout Tree Indigenous Data Sovereignty, Indigenous Data Systems /// Shanawdithit's Maps as Data System/// The Colonial Archive and the Lookout Tree THIS SECTION IS ONE THAT POINTS TO LONG HISTORY OF INDIGEOUS DATA VISUALIZATION BUT RESISTS GOING THERE; ISNTEAD VISUALIZES COLONIAL ARCHIVE, SOURCES, ETC.
Like Willard, Shanawdithit also produced multiple maps, although less is known about the intention—if any—behind their ordering. When reproducing them for his volume, Howley places them in chronological order (238), listing MENTION WHAT THE FIVE MAPS SHOW. but it is unclear as to whether they were drawn in that order or conceived in sequence. It is also worth noting that Shanawdithit accompanied her five maps with drawings of other aspects of Beothuk cultural life. With the sensitivity to colonial power that frames the maps, as Goeman would likely advice, their sequence—like Willard's—enforces a narrative of the extinction of the Beothuk people, as well as about the role that data played in that process.
[ FIVE MAPS, HOVER TO SELECT LIKE DU BOIS ]
As PERSON observes, QUOTE ABOUT COLONIAL DATA / NUMBERS / MEASUREMENT OF NATIVE PEOPLES. This knowledge-via-quantification is no clearer than the so-called Sketch IV, which depicts a significant swath of the Exploits River. Howley observes that it is drawn in black pencil only "because I presume as no whitemen figured in this one, there was no occasion to make a distinction by the use of the black and red lines" (243). And while there might not have been settlers pictured in Shanawdithit's rendering of the water and land, there is a clear presence of "whitemen" in the form of Cormack's annotations, which—also by Howelys' account, were "written all over it" (243). These notes are largely numerical, representing Cormack's attempt to enumerate the Beothuk population during the final years of its existence as an independent nation. (Note about merging into M'iqmaq, Innu). At the top of the page are two sets of enumerations of the Beothuk population—the first in March 1823, indicated by an "A," and the second in April 1823, indicated by a "C," between which the population had diminished from 27 to 19. Corrmack provides separate counts for men, women, children, and the dead, who are summed together through arithmetic notation. At various places on the map, Cormack transcribes what (presumably) Shanawdithit told him about the people who inhabited the land pictured. These appear to be written with ease. This stand in contrast to the large table of population statistics at the center of the chart, which while presented in clear tabulations in Howely's recreation, in the original contains more scribblings and crossings-out than numbers. Cormack clearly strained to arrive at precise population figures—his intended goal and the ultimate arbiter of colonial knowledge about the Beothuk—this in contrast to Shanawdithit's smooth lines that document the landscape's physical geography.
[ SCROLLYTELL LIKE ABOVE ]
This map vivifies the extractive statistical practices that have motivated deep suspicion of colonial data by Indigenous peoples, as well as the motivation for the development of Indigenous data practices—and Indigenous research protocols more generally—that can counter these extractive moves. Grouped together under the concept of Indigenous Data Soverignty, proposals such as the CARE principles for data sovereignty, or the ANOTHER EXAMPLE for Indigenous cultural heritage, show how the principles and practices of data collection, analysis, and—indeed, visualization—can be reconsidered through an Indigenous lens. As AUTHORS explain, "For Indigenous Peoples, the statistics and data themselves per se, are not the problem. From a policy perspective, the far more critical question is how are such numbers deployed and what and whose purposes do they, and their attendant narratives, serve" (2). As settler scholars without Beothuk partners in this project, we cannot fully realize these principles here. But we can keep them in mind as we continue to work towards methods that acknowledge and account for the colonial frame. As a first step we might reconsider the visualizations that structure our work as only one component of a broader data system, one which includes the people who created the data, the context, events, etc etc. Here an example of another Indigenous data visualization practice, the wampum belt, is instructive. Below is pictured the famed two-row wampum created by the Haudenosaunee, [ IMAGE OF TWO-ROW WAMPUM ]
Kaswenta is symbolized by a wampum belt crafted from the white shells of the channelled whelk snail and the purple shells of the qualog clam. Across the belt flow 9 rows of white shells that represent the River of Life. There are 4 rows of purple shells forming two separate horizontal lines in the center of the belt. One purple row denotes the Haudenosaunee canoe, the other is the European tall ship. The three white shells separating them shows a respectful relationship based on peace, trust, and friendship - all values inherent in Kayanerenkó:wa also known as The Great Law of Peace.The strings flowing on each side of the belt show that more beads can be added and, therefore, the relationship is eternal. The two rows never intersect; they are parallel. This denotes a separate-but-equal relationship that respects each other's sovereignty. The Haudenosaunee never steer the Dutch ship, and the Dutch never steer the Haudenosaunee canoe as they both travel down the River of Life. Both parties respect each other's autonomy and interdependence. Haudenosaunee consider the Kaswenta as a valid and ongoing treaty. Some settlers refuse to acknowledge this because of a single forged document. These settlers claim that the Two Row Wampum is a modern construction used to satisfy contemporary political needs but those ignorant, and racist, claims misrepresent the actual data source. Wampum belts are not a replacement for paper, they embody a different way of thinking about data. These belts act as symbolic reminders and public demonstrations of active and ongoing relationships. Haudenosaunee use them as a guide to help narrate complex understandings of sacred promises made between both parties involved and the Creator. … Wampum belts are part of a complex data system that records, stores, analyzes and shares information for as long as is necessary. The belts themselves are just a part of the data system, that's why the Canadian government failed to destroy Haudenosaunee databases and explains why they are still such a potent symbol of Indigenous sovereignty and an excellent example of Indigenous Data Sovereignty in practice. While labour intensive, the belts can be remade and many remain as part of a living treaty system still recognized hundreds of years after the treaties were first made. This is because the belts are part of an ongoing relationship between the treaty holders, the leaders involved, the people they serve, and the Creator. They don't depend on one way to store a record, they store it with multiple knowledge holders as well as the community at large. These records are refreshed by authorized leaders in diplomatic missions and internal community decision making. They are visible reminders of something that cannot be denied as long as the people remain -- Kelsey, Reading the Wampum Idea of Iriquois "visual code, a set of mutually understood symbols and images that communicate culturally-embedded ideas to the viewer" xii Angela Haas, "In order to memorize the belt and its story, the trained individaul would impress in the mind the visual representaiotn of the belt and subsequently forge mnemonic associations between the visual representation of the belt and the accompnayin story. Thus the wampum "reader" or presenter can trace the nodes of information and can link their associated inherited knowledge by tracing the embedded stories "told" by wampum and sinew hypertext… xviii The Two Row Wampum depicts the Hodiohso:ni' in a canoe and the Dutch in a ship sailing down the river of life with each group retaining their own language, culture, spirituality, and ways of being and not forcing their beliefs on the other group. xi BROOKS, RELATION B/T MAP AND WAMPUM Whiel awikhjoganak were often temporary, characterized by their "portability," wampum symbolized permanence. When an agreemtn, an alliance, or an event was put in wampum, a transformation in Native space was solidified. 10 Awikhjoganak and wampum were facets of an indigenous writing system that was based on ‘cartographic principles.' The graphic symbols used in both forms represented the relatinoships between people, between places, between humans and nonhumans, between the waterways that joined them. The communal stories recored on birchbark and in wampum would even connect people with relatinos across time, bringing the past, present, and future into the same space. 12 citing Malcolm Lewis MAP OF HAUDENOSAUNEE THAT LOOKS LIK NEW YORK: https://blogs.loc.gov/loc/2021/11/native-american-maps-and-ideas-that-shaped-the-nation/
What we learn from the map and the wampum is that TIME , LAND, ARCHIVE ALL RELATED. How might we visualize the data system that gave rise to Shanawdithit's maps and that has preserved them into the present? Below is pictured a diagram of the people, places, archives, sources, dates… [DO THIS VIS]
Takeaways for designers
- Takeaway 1 Excepteur sint occaecat cupidatat non proident, sunt in culpa qui officia deserunt mollit anim id est laborum.
- Takeaway 2 Excepteur sint occaecat cupidatat non proident, sunt in culpa qui officia deserunt mollit anim id est laborum.
- Takeaway 3 Excepteur sint occaecat cupidatat non proident, sunt in culpa qui officia deserunt mollit anim id est laborum.
Takeaways for viewers
- Takeaway 1 Excepteur sint occaecat cupidatat non proident, sunt in culpa qui officia deserunt mollit anim id est laborum.
- Takeaway 2 Excepteur sint occaecat cupidatat non proident, sunt in culpa qui officia deserunt mollit anim id est laborum.
- Takeaway 3 Excepteur sint occaecat cupidatat non proident, sunt in culpa qui officia deserunt mollit anim id est laborum.
